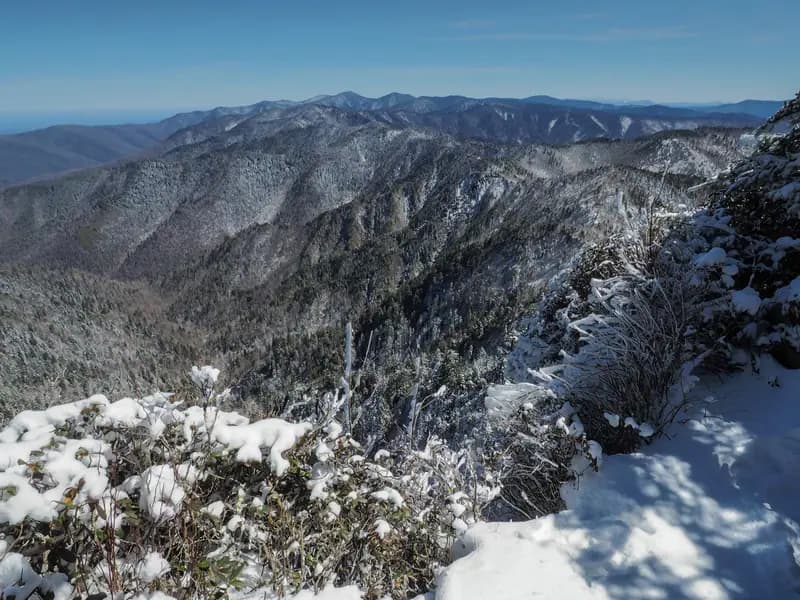
Photo: NPS / Bob Carr
North Carolina · Tennessee
Great Smoky Mountains National Park
- 2025 visits
- 11,527,939
- vs 2024
- −5.4%
- Busiest month
- October
- Quiet shoulder month
- November
Photo: NPS / Bob Carr
North Carolina · Tennessee
Photo: NPS Photo / Shane Carte
Photo: NPS / Jacob W. Frank
Idaho · Montana · Wyoming
By the numbers
36 parks drew more visits than in 2024 and 27 drew fewer. Great Smoky Mountains alone accounted for 12% of all national park visits.
All 63, ranked
Recreation visits from NPS Visitor Use Statistics. Sequoia and Kings Canyon are listed separately, as NPS reports them.
2024 → 2025
Before reading a story into a big swing: NPS notes that parks change how they count visitors from time to time, which can shift a park’s trend. Each park’s IRMA report has the month-by-month detail.
Methodology
What’s counted. Recreation visits: one person entering a park for recreation, counted at most once a day. Commuters, through traffic and people working in the park don’t count. That’s the National Park Service’s definition, and these are its numbers.
Where it’s from. Monthly recreation visits for 2021–2025 from NPS Visitor Use Statistics (IRMA), downloaded October 1, 2026. Each annual total is the sum of its 12 months. Our top 10 matches the NPS 2025 visitation release park for park.
Sequoia and Kings Canyon. They’re run as one unit, but they are two separately established national parks, and NPS reports visits separately for parks like that. So they rank separately here, as #23 and #30. Together, their 2,158,128 visits would place them #16.
Odd months stay in. We keep every month as NPS reports it. In 2025, 10 park-months came in far below the same month in other years, including Petrified Forest in October (0), Mammoth Cave in October (12,646) and Carlsbad Caverns in October (0). 9 of them fall between October and December, and NPS's 2025 release notes a 43-day partial government shutdown that year.
The big picture. The 63 national parks drew 29.1% of the 323,014,305 recreation visits NPS recorded at its 406 reporting sites in 2025, in line with the 29% NPS gives for national parks. The rest went to parkways, recreation areas, memorials, monuments, seashores and the other kinds of NPS sites.
Cite this data
Source: National Park Service, Visitor Use Statistics (irma.nps.gov/Stats), 2025 recreation visits. Compiled by Park'd, parkd.app/most-visited-national-parks, as of October 1, 2026.
Planning a trip, not a story?
FAQ

Park'd · free on iPhone & Android
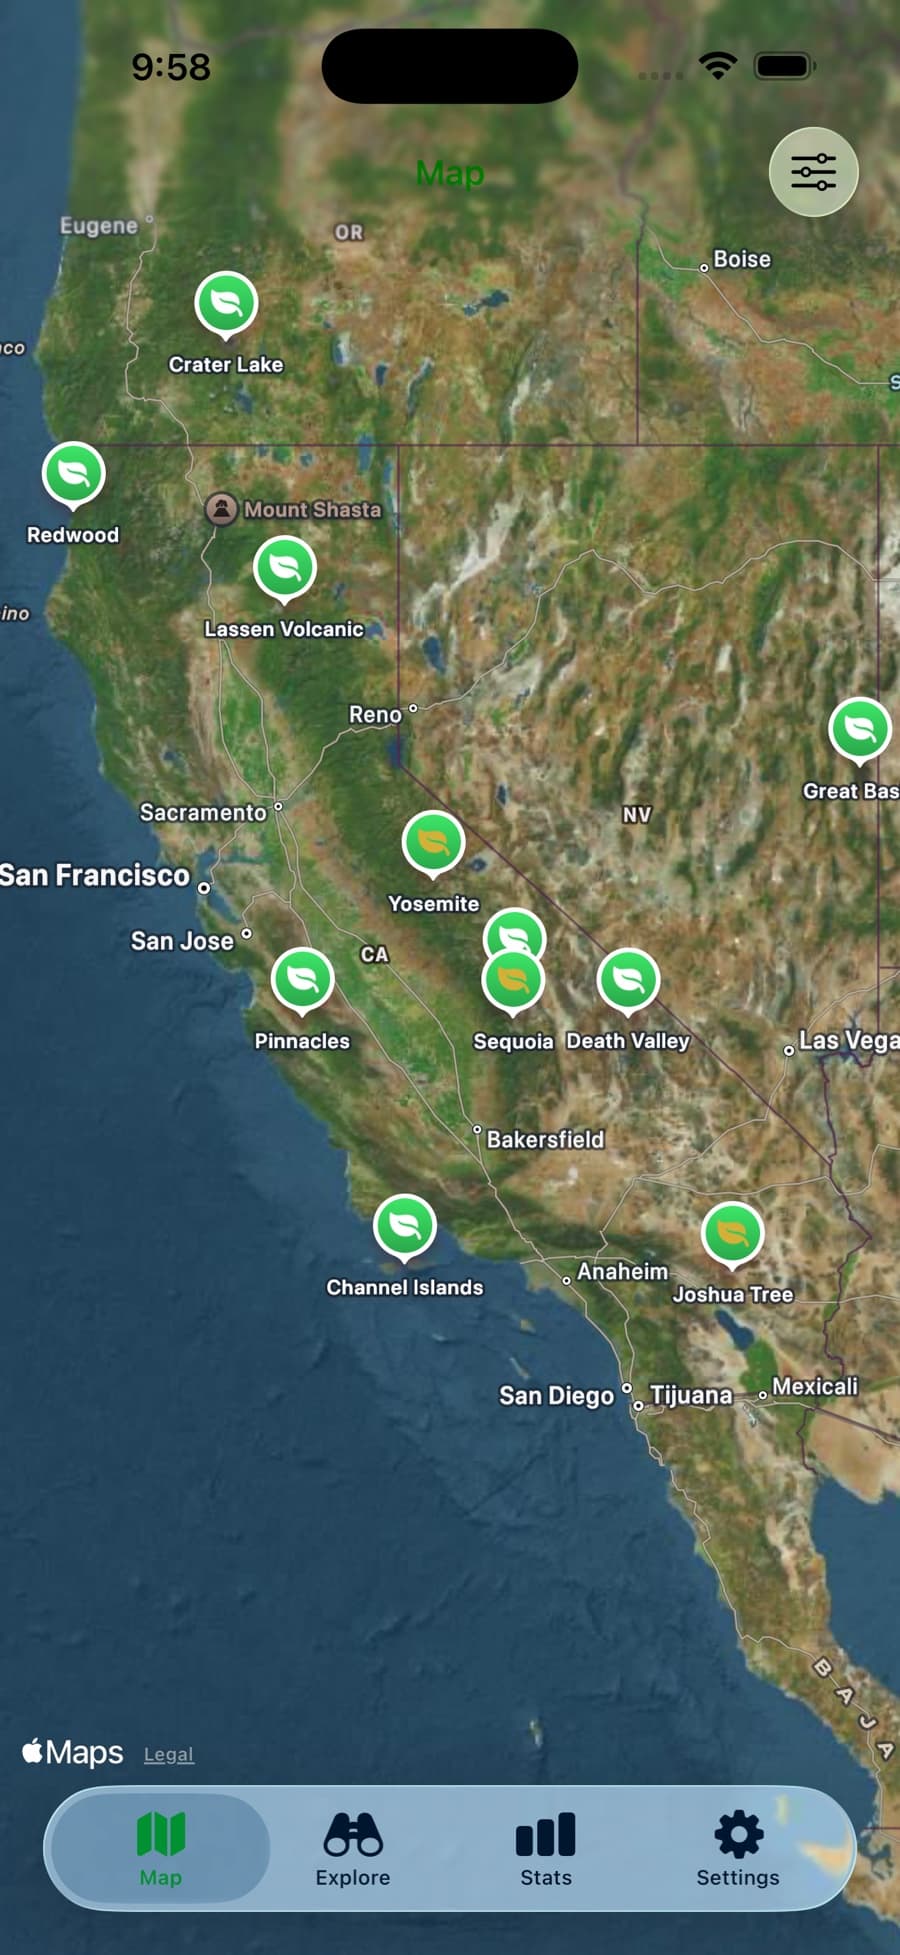
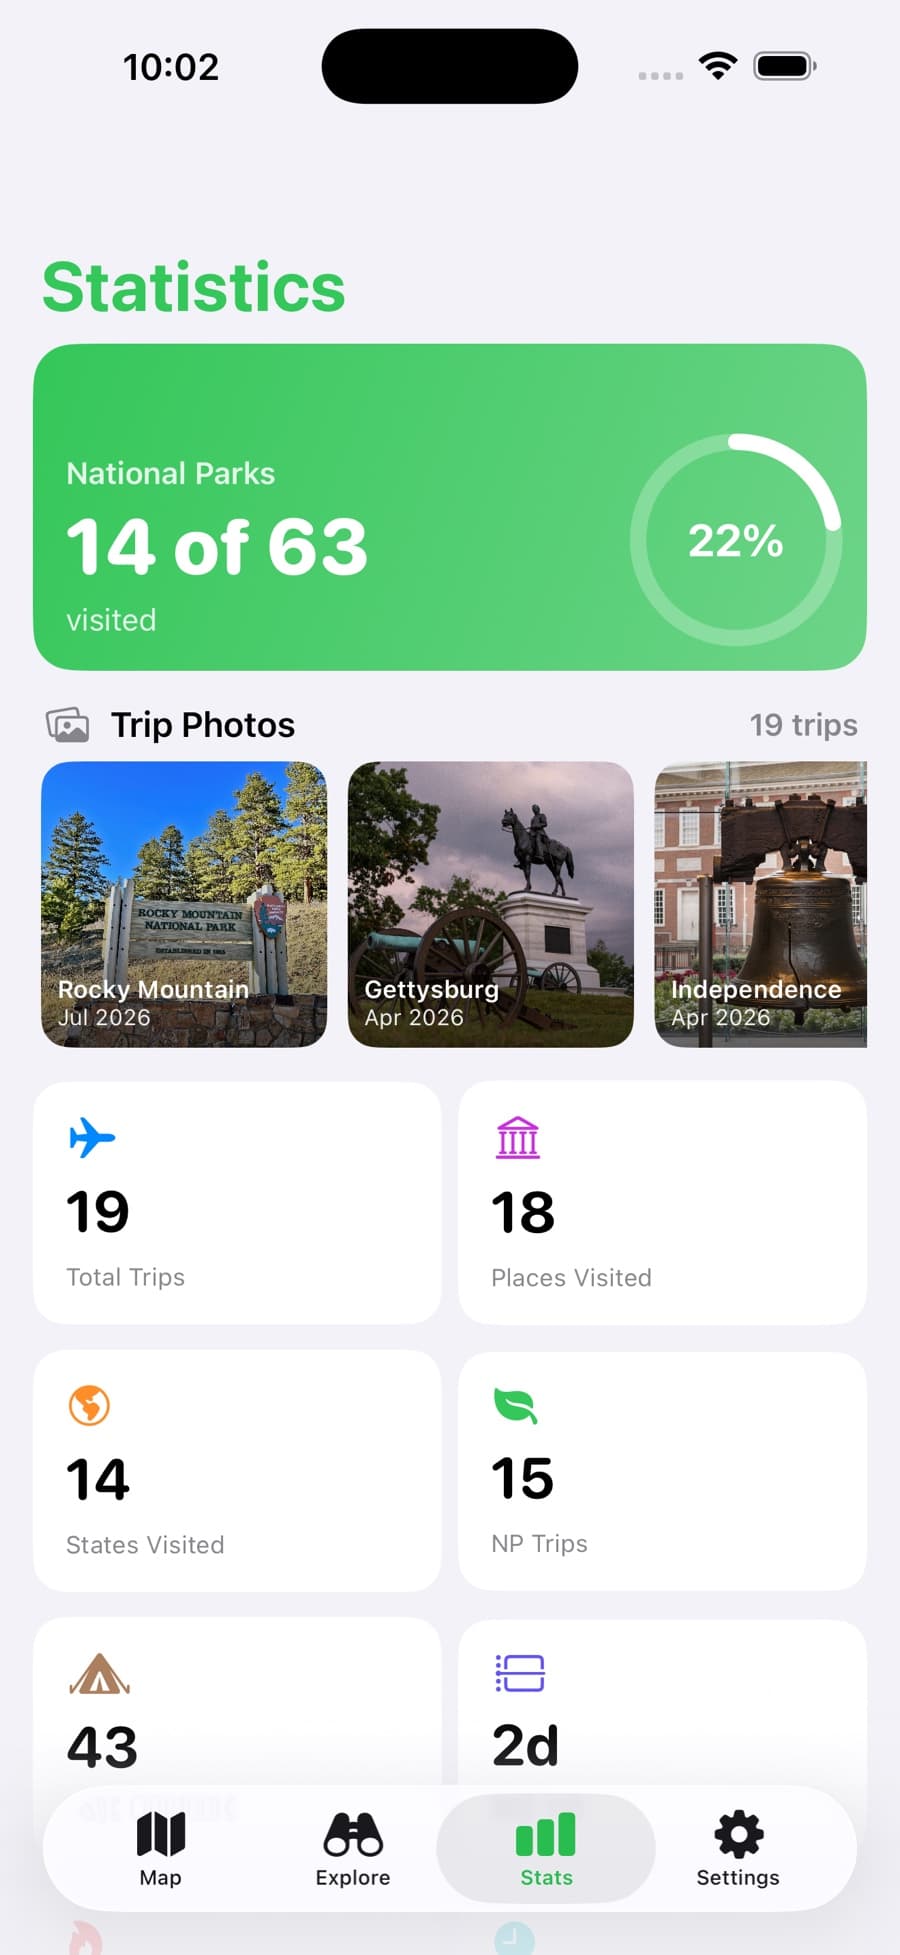
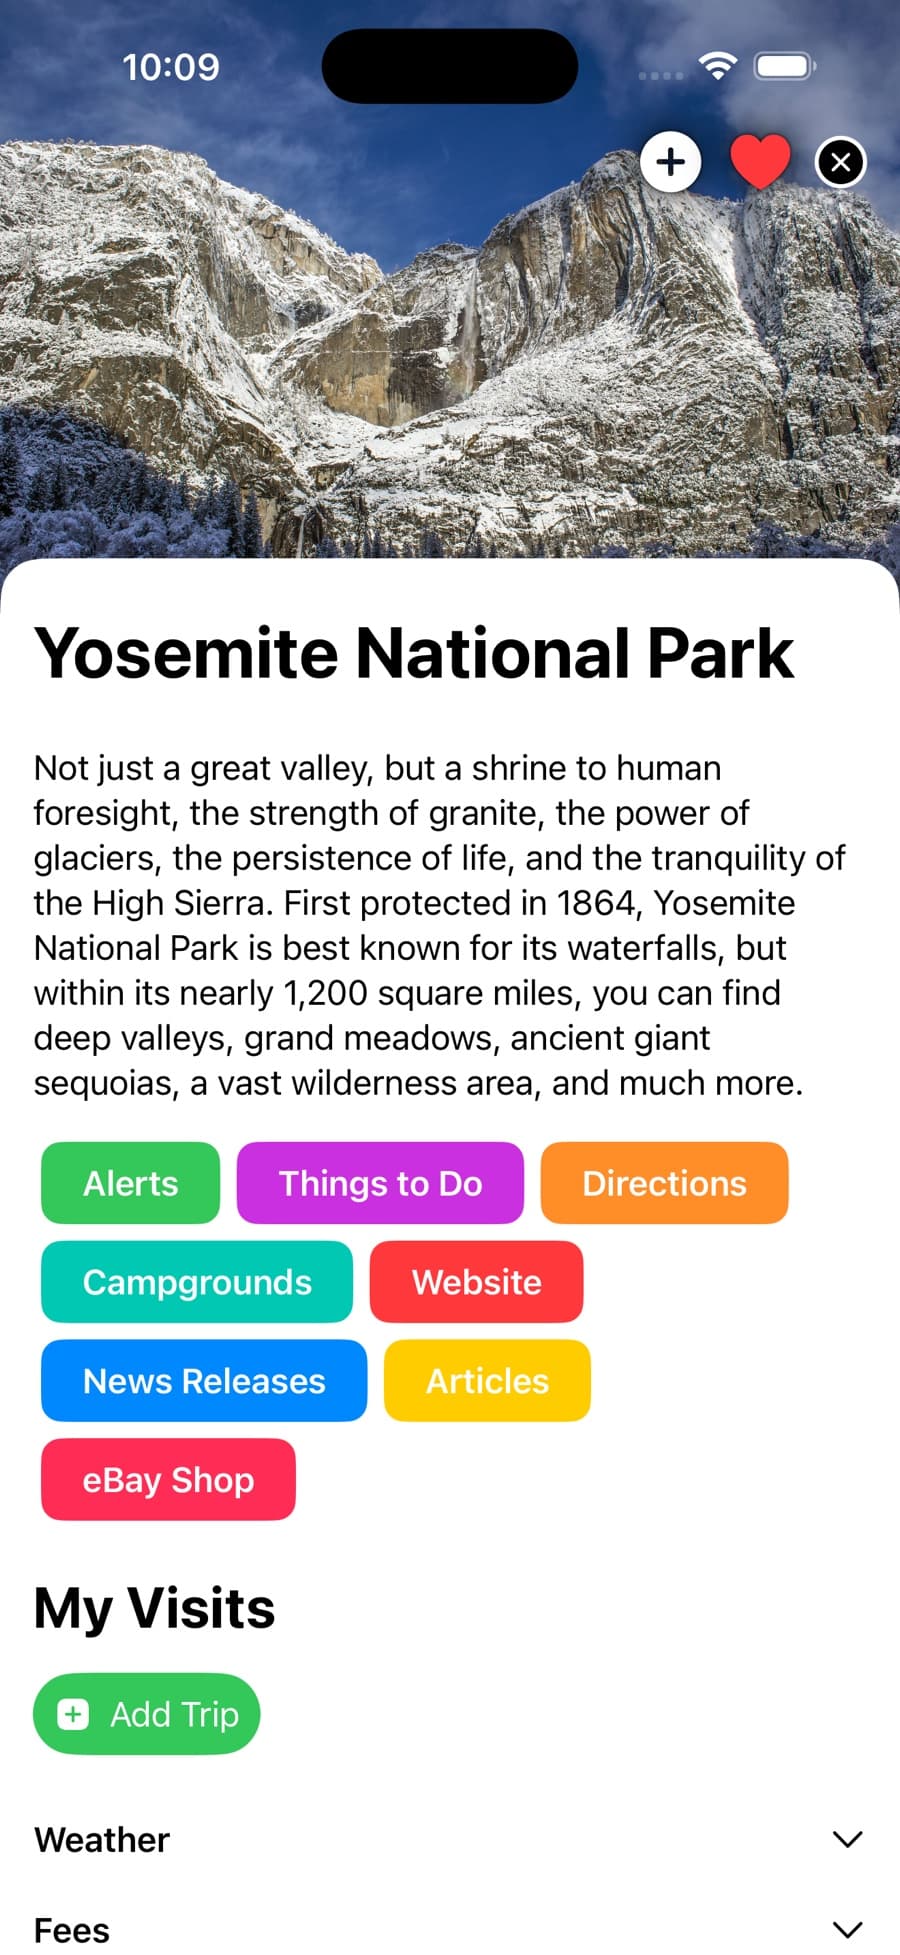
Park'd for iPhone and Android: check off every national park on a map, log trips with photos, notes and a favorite memory, and watch your stats and badges grow.