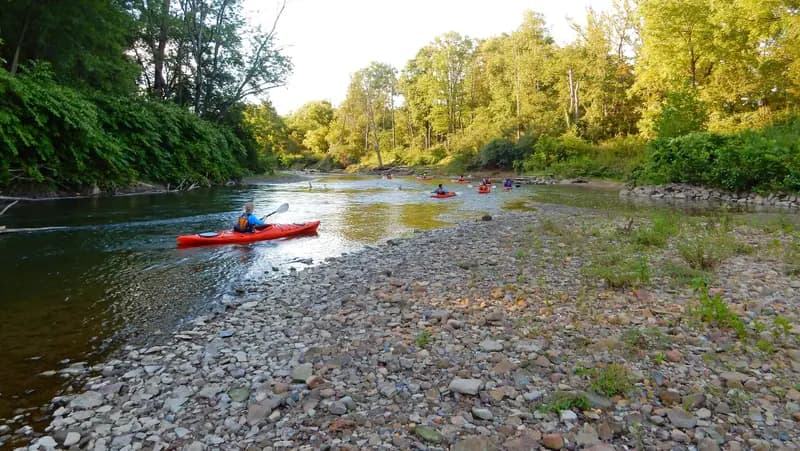
Photo: NPS Photo / D.J. Reiser
Ohio
Cuyahoga Valley National Park
- April avg visits
- 236,806
- Busiest month
- July
Cuyahoga Valley averages 236,806 visits in April, 64% of its July peak. Crowds are building: 51% in March, 82% in May.
Photo: NPS Photo / D.J. Reiser
Ohio
Photo: NPS Photo / Peter Densmore
Utah
Photo: NPS Photo
Utah
The % badge is April’s visitors as a share of the park’s busiest month.
Shoulder season · 9 parks
1. Cuyahoga Valley National ParkOhio
Cuyahoga Valley averages 236,806 visits in April, 64% of its July peak. Crowds are building: 51% in March, 82% in May.
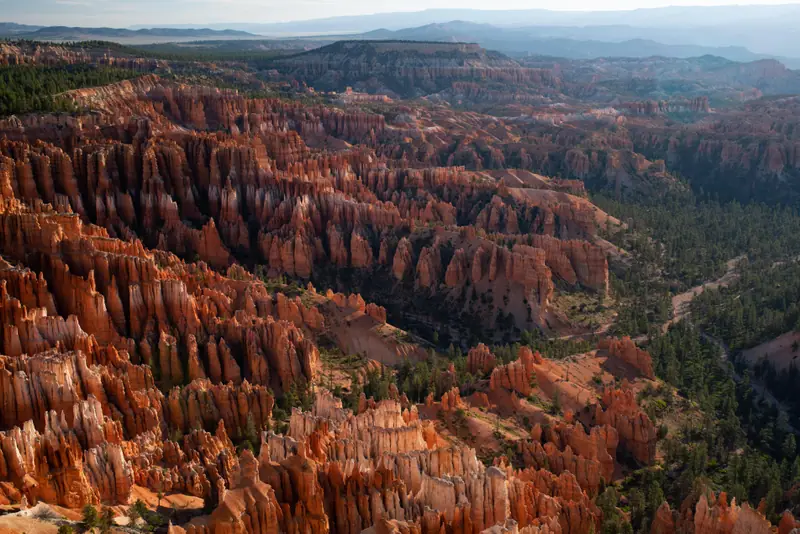
2. Bryce Canyon National ParkUtahIts quiet month
Bryce Canyon averages 215,140 visits in April, 65% of its June peak. Crowds are building: 30% in March, 90% in May. By our rule, this is Bryce Canyon's quiet shoulder month.
3. Petrified Forest National ParkArizonaIts quiet month
Petrified Forest averages 42,469 visits in April, 66% of its June peak. March runs 74% and May 91%. By our rule, this is Petrified Forest's quiet shoulder month.
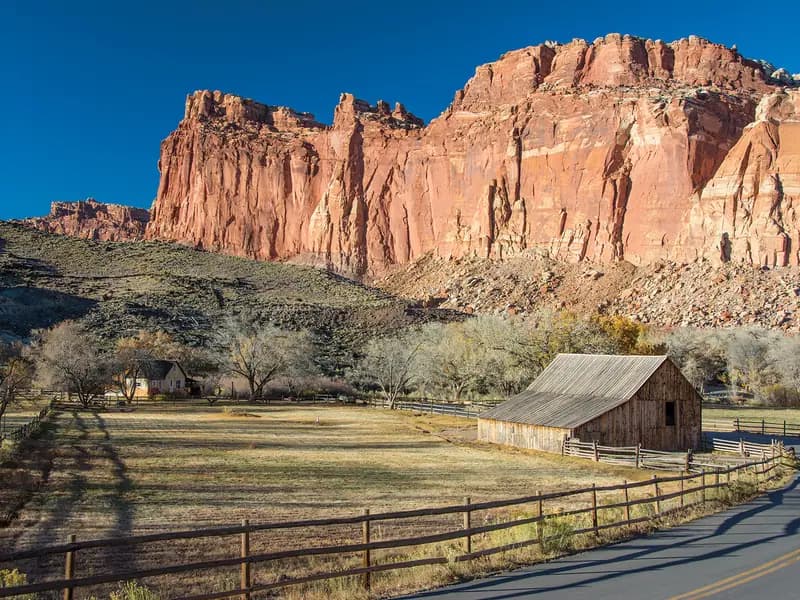
4. Capitol Reef National ParkUtah
Capitol Reef averages 149,112 visits in April, 70% of its May peak. Crowds are building: 44% in March, 100% in May.
5. Big Bend National ParkTexas
Big Bend averages 66,154 visits in April, 71% of its March peak. Crowds are thinning: 100% in March, 46% in May.
6. Saguaro National ParkArizonaIts quiet month
Saguaro averages 112,570 visits in April, 72% of its March peak. Crowds are thinning: 100% in March, 41% in May. By our rule, this is Saguaro's quiet shoulder month.
7. Carlsbad Caverns National ParkNew Mexico
Carlsbad Caverns averages 37,244 visits in April, 73% of its July peak. Crowds are thinning: 92% in March, 67% in May.
8. White Sands National ParkNew Mexico
White Sands averages 77,761 visits in April, 78% of its March peak. Crowds are thinning: 100% in March, 71% in May.
9. Guadalupe Mountains National ParkTexas
Guadalupe Mountains averages 27,647 visits in April, 79% of its March peak. Crowds are thinning: 100% in March, 56% in May.
Low season · 17 parks
Mesa Verde National ParkColorado
Mesa Verde averages 27,901 visits in April, 30% of its June peak. Crowds are building: 17% in March, 60% in May.
Kings Canyon National ParkCalifornia
Kings Canyon averages 34,946 visits in April, 30% of its July peak. Crowds are building: 14% in March, 71% in May.
Great Basin National ParkNevada
Great Basin averages 8,053 visits in April, 31% of its July peak. Crowds are building: 10% in March, 58% in May.
Wind Cave National ParkSouth Dakota
Wind Cave averages 38,618 visits in April, 32% of its July peak. Crowds are building: 15% in March, 56% in May.
Gateway Arch National ParkMissouri
Gateway Arch averages 150,887 visits in April, 32% of its July peak. March runs 35% and May 36%.
Indiana Dunes National ParkIndiana
Indiana Dunes averages 166,419 visits in April, 33% of its July peak. Crowds are building: 26% in March, 57% in May.
Kobuk Valley National ParkAlaska
Kobuk Valley averages 666 visits in April, 37% of its July peak. March runs 39% and May 38%. No road in: you arrive by boat or plane, per NPS.
New River Gorge National Park & PreserveWest Virginia
New River Gorge averages 113,265 visits in April, 40% of its July peak. Crowds are building: 33% in March, 70% in May.
Shenandoah National ParkVirginia
Shenandoah averages 126,576 visits in April, 40% of its October peak. Crowds are building: 23% in March, 50% in May.
Sequoia National ParkCalifornia
Sequoia averages 82,305 visits in April, 42% of its July peak. Crowds are building: 29% in March, 62% in May.
Redwood National and State ParksCalifornia
Redwood averages 40,599 visits in April, 43% of its June peak. Crowds are building: 34% in March, 68% in May.
Yosemite National ParkCalifornia
Yosemite averages 256,083 visits in April, 48% of its August peak. Crowds are building: 25% in March, 71% in May.
Mammoth Cave National ParkKentucky
Mammoth Cave averages 62,748 visits in April, 63% of its July peak. March runs 62% and May 62%.
Great Smoky Mountains National ParkNorth Carolina · Tennessee
Great Smoky Mountains averages 1,029,746 visits in April, 64% of its October peak. Crowds are building: 55% in March, 77% in May.
Hot Springs National ParkArkansas
Hot Springs averages 234,658 visits in April, 68% of its June peak. Crowds are thinning: 72% in March, 66% in May.
Channel Islands National ParkCalifornia
Channel Islands averages 24,905 visits in April, 69% of its July peak. Crowds are building: 60% in March, 72% in May. No road in: you arrive by boat or plane, per NPS.
Hawaiʻi Volcanoes National ParkHawaii
Hawaiʻi Volcanoes averages 109,889 visits in April, 73% of its December peak. March runs 79% and May 75%.
Peak season · 14
Under 30% of the peak: few visitors, and services may be limited.
Likely closed · 6
These parks average almost no recreation visits in April. That usually means a seasonal closure or no way in, but it’s our inference from the numbers, not an NPS notice. Check before you go:
How we rank
Every number here is National Park Service recreation visits, averaged by calendar month over 2021–2025. A park’s crowd index compares each month with its own busiest month (100). Peak season is 80 or above; shoulder months border the peak and still reach 30. We rank shoulder months quietest first.
We don’t score weather, and a quiet month can be quiet because of it. The crowd calendar has the full method and every park’s twelve months side by side; each park page links to its nps.gov conditions.
April 2025 at a glance
FAQ

Park'd · free on iPhone & Android
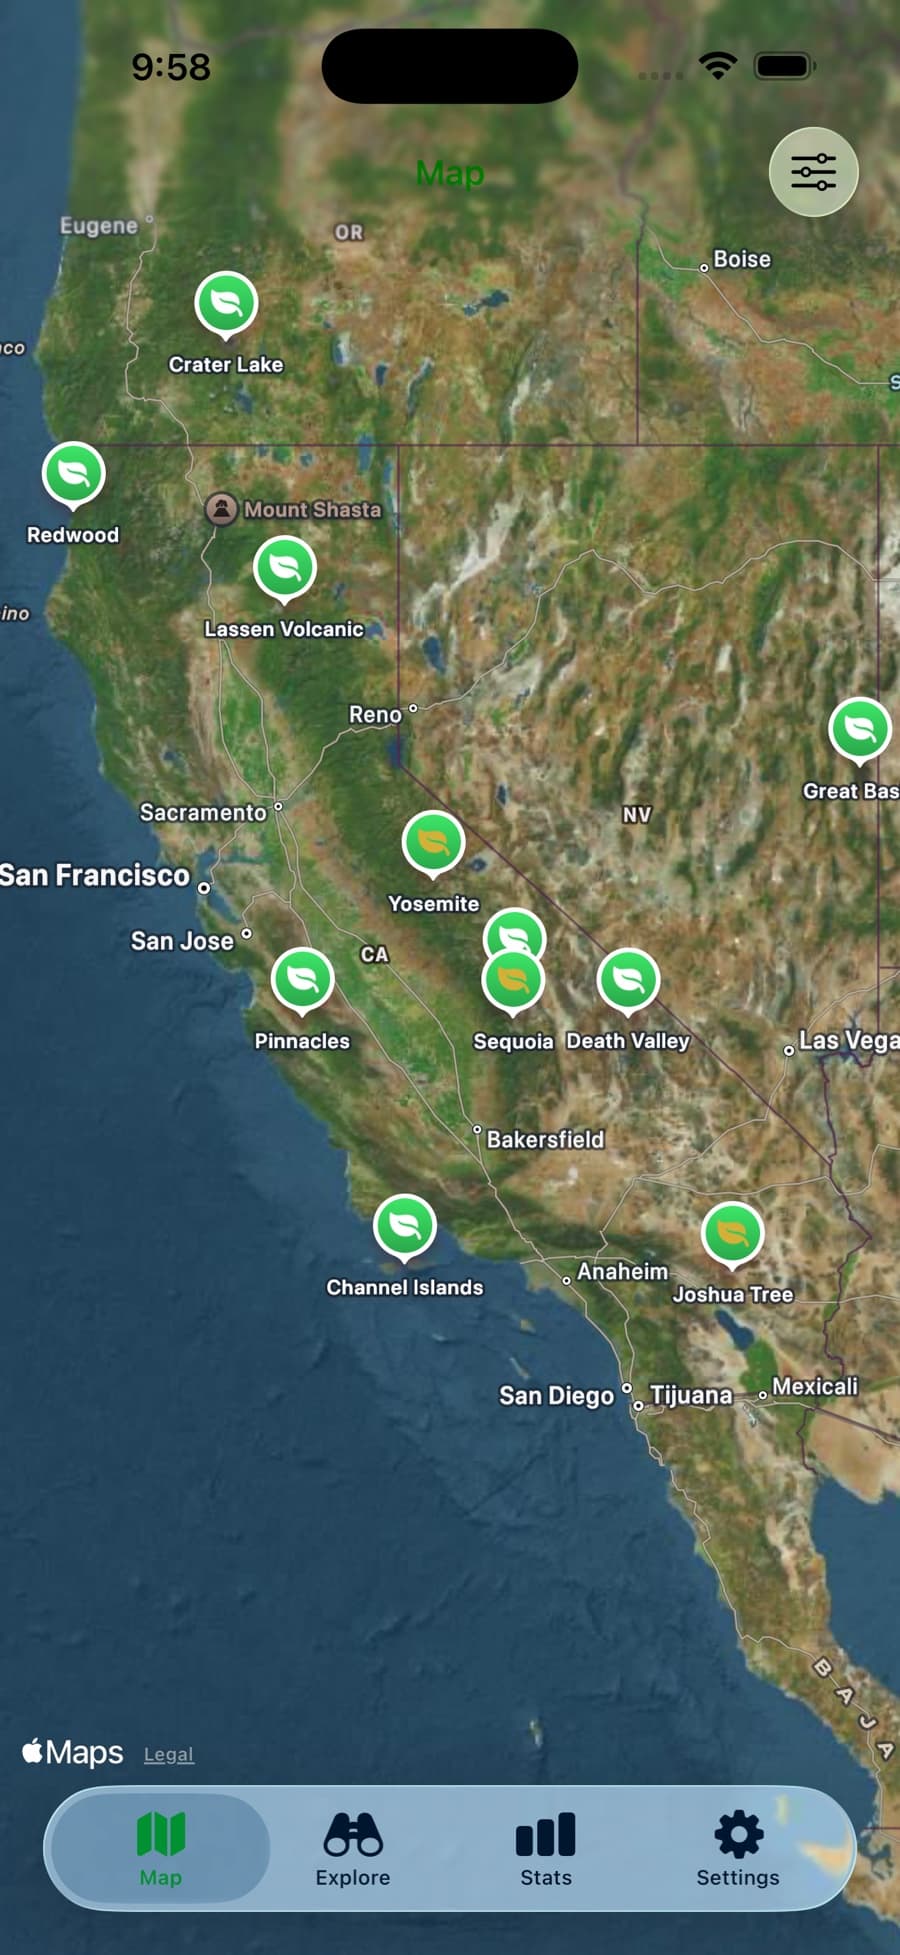
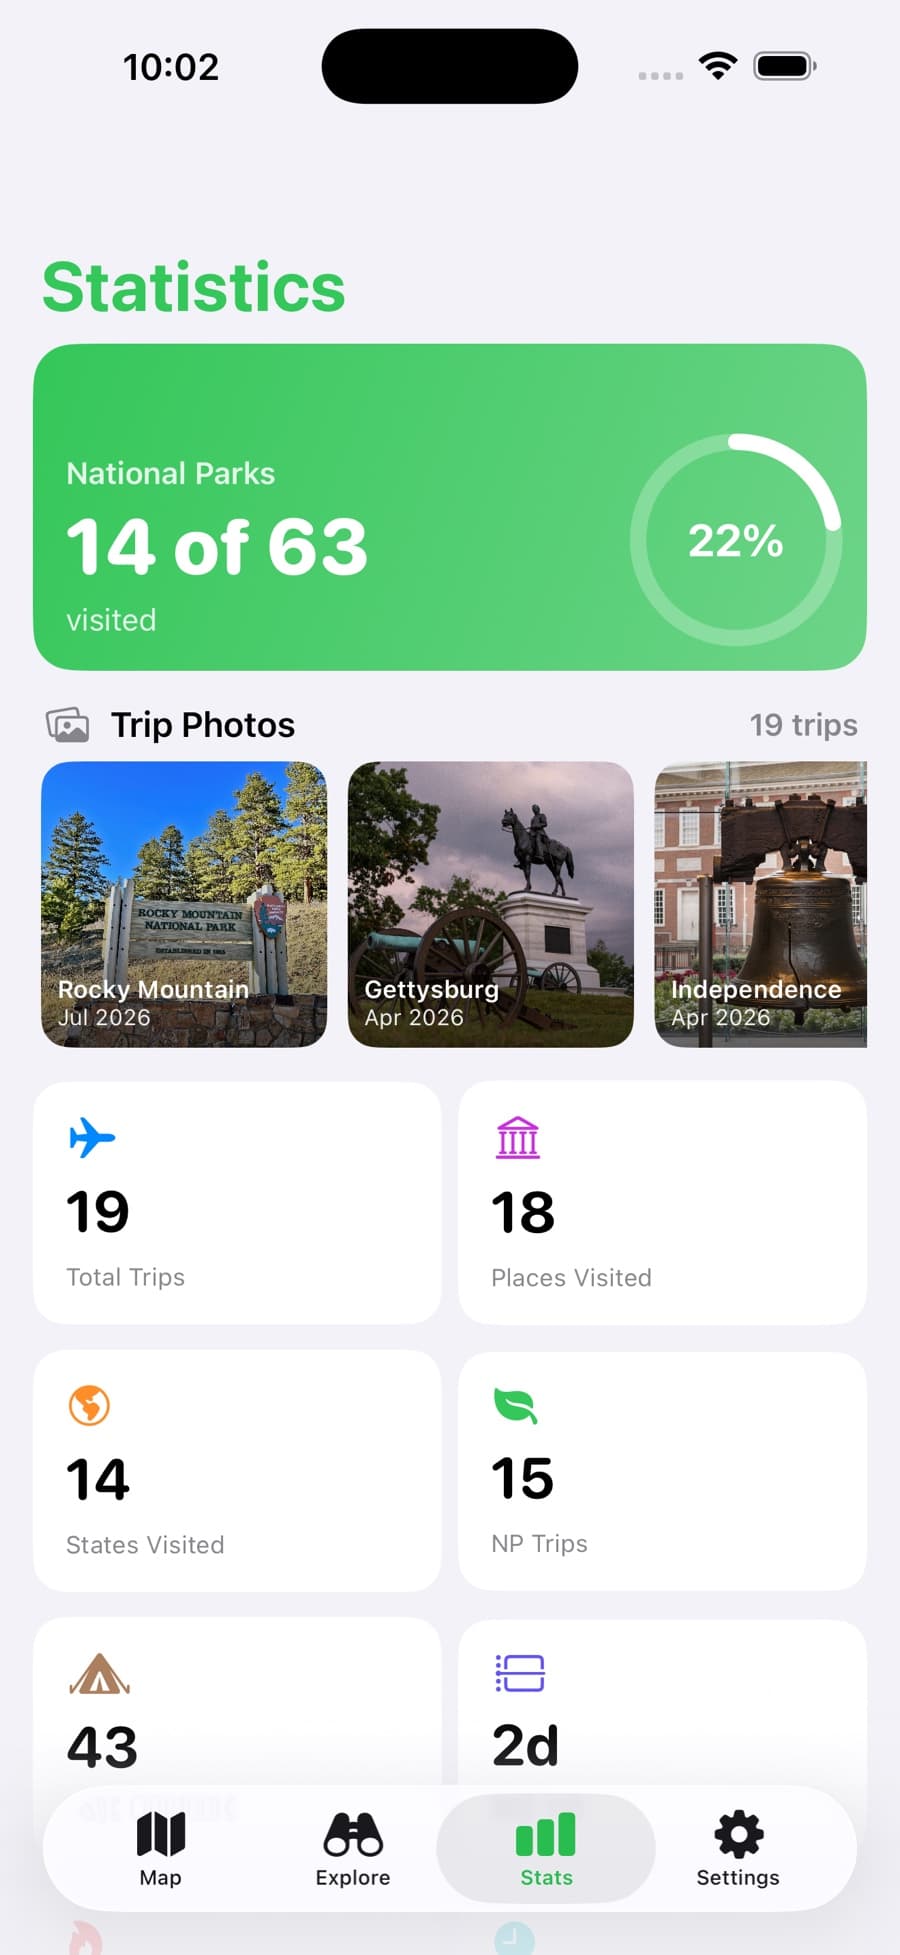
Park'd for iPhone and Android: check off every national park on a map, log trips with photos, notes and a favorite memory, and watch your stats and badges grow.