Photo: NPS / Bob Carr
North Carolina · Tennessee
Great Smoky Mountains National Park
- November avg visits
- 992,043
- Busiest month
- October
Photo: NPS / Bob Carr
North Carolina · Tennessee
Photo: NPS Photo / Shane Carte
Utah
Photo: NPS/M. Quinn
Arizona
The % badge is November’s visitors as a share of the park’s busiest month.
Shoulder season · 10 parks
1. Capitol Reef National ParkUtahIts quiet month
Capitol Reef averages 64,075 visits in November, 30% of its May peak. Crowds are thinning: 80% in October, 15% in December. By our rule, this is Capitol Reef's quiet shoulder month.
2. Cuyahoga Valley National ParkOhioIts quiet month
Cuyahoga Valley averages 171,342 visits in November, 46% of its July peak. Crowds are thinning: 80% in October, 34% in December. By our rule, this is Cuyahoga Valley's quiet shoulder month.
3. Shenandoah National ParkVirginiaIts quiet month
Shenandoah averages 151,769 visits in November, 48% of its October peak. Crowds are thinning: 100% in October, 11% in December. By our rule, this is Shenandoah's quiet shoulder month.
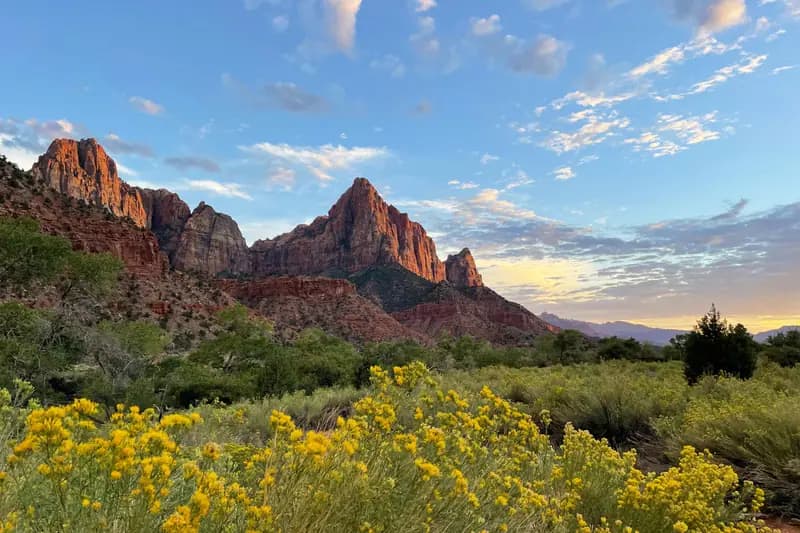
4. Zion National ParkUtahIts quiet month
Zion averages 301,264 visits in November, 50% of its June peak. Crowds are thinning: 82% in October, 36% in December. By our rule, this is Zion's quiet shoulder month.
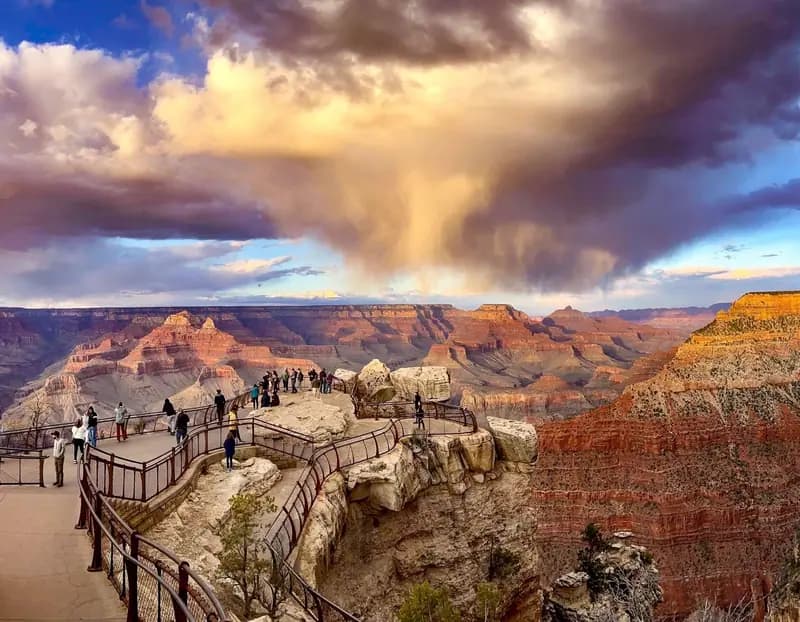
5. Grand Canyon National ParkArizonaIts quiet month
Grand Canyon averages 326,699 visits in November, 62% of its July peak. Crowds are thinning: 83% in October, 56% in December. By our rule, this is Grand Canyon's quiet shoulder month.
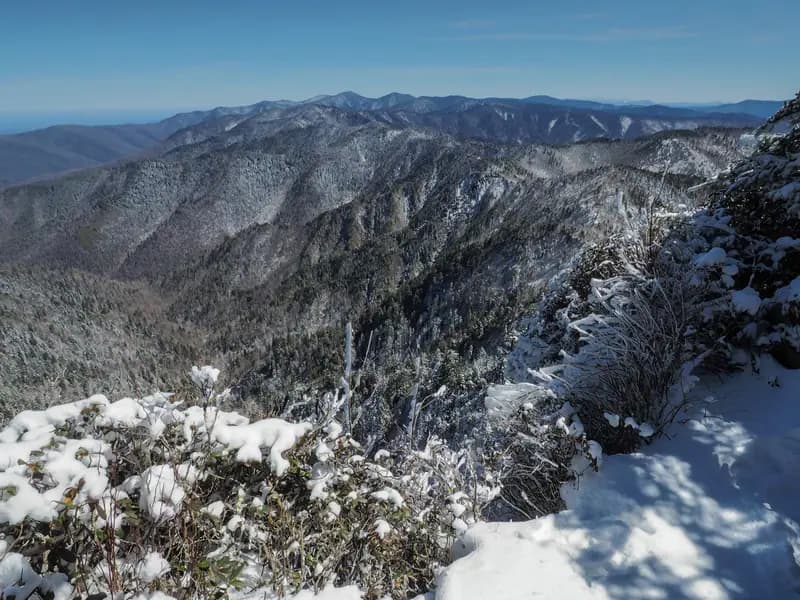
6. Great Smoky Mountains National ParkNorth Carolina · TennesseeIts quiet month
Great Smoky Mountains averages 992,043 visits in November, 62% of its October peak. Crowds are thinning: 100% in October, 47% in December. By our rule, this is Great Smoky Mountains' quiet shoulder month.
7. Virgin Islands National ParkUS Virgin IslandsIts quiet month
Virgin Islands averages 27,365 visits in November, 69% of its March peak. Crowds are building: 40% in October, 89% in December. By our rule, this is Virgin Islands' quiet shoulder month.
8. Kobuk Valley National ParkAlaskaIts quiet month
Kobuk Valley averages 1,297 visits in November, 72% of its July peak. October runs 91% and December 75%. By our rule, this is Kobuk Valley's quiet shoulder month. 2025 reported just 99 visits this month (usually about 1,596), kept as reported. No road in: you arrive by boat or plane, per NPS.
9. Dry Tortugas National ParkFloridaIts quiet month
Dry Tortugas averages 6,410 visits in November, 74% of its May peak. Crowds are building: 57% in October, 84% in December. By our rule, this is Dry Tortugas' quiet shoulder month. No road in: you arrive by boat or plane, per NPS.
10. Joshua Tree National ParkCalifornia
Joshua Tree averages 312,571 visits in November, 76% of its March peak. Crowds are building: 51% in October, 83% in December.
Low season · 21 parks
Redwood National and State ParksCalifornia
Redwood averages 28,514 visits in November, 30% of its June peak. Crowds are thinning: 52% in October, 24% in December.
Sequoia National ParkCalifornia
Sequoia averages 60,188 visits in November, 31% of its July peak. Crowds are thinning: 48% in October, 24% in December.
Mammoth Cave National ParkKentucky
Mammoth Cave averages 32,634 visits in November, 33% of its July peak. Crowds are thinning: 56% in October, 29% in December.
New River Gorge National Park & PreserveWest Virginia
New River Gorge averages 92,564 visits in November, 33% of its July peak. Crowds are thinning: 69% in October, 18% in December.
National Park of American SamoaAmerican Samoa
American Samoa averages 1,087 visits in November, 35% of its April peak. Crowds are thinning: 45% in October, 17% in December. 2025 reported just 252 visits this month (usually about 1,065), kept as reported.
Canyonlands averages 42,203 visits in November, 35% of its May peak. Crowds are thinning: 79% in October, 16% in December.
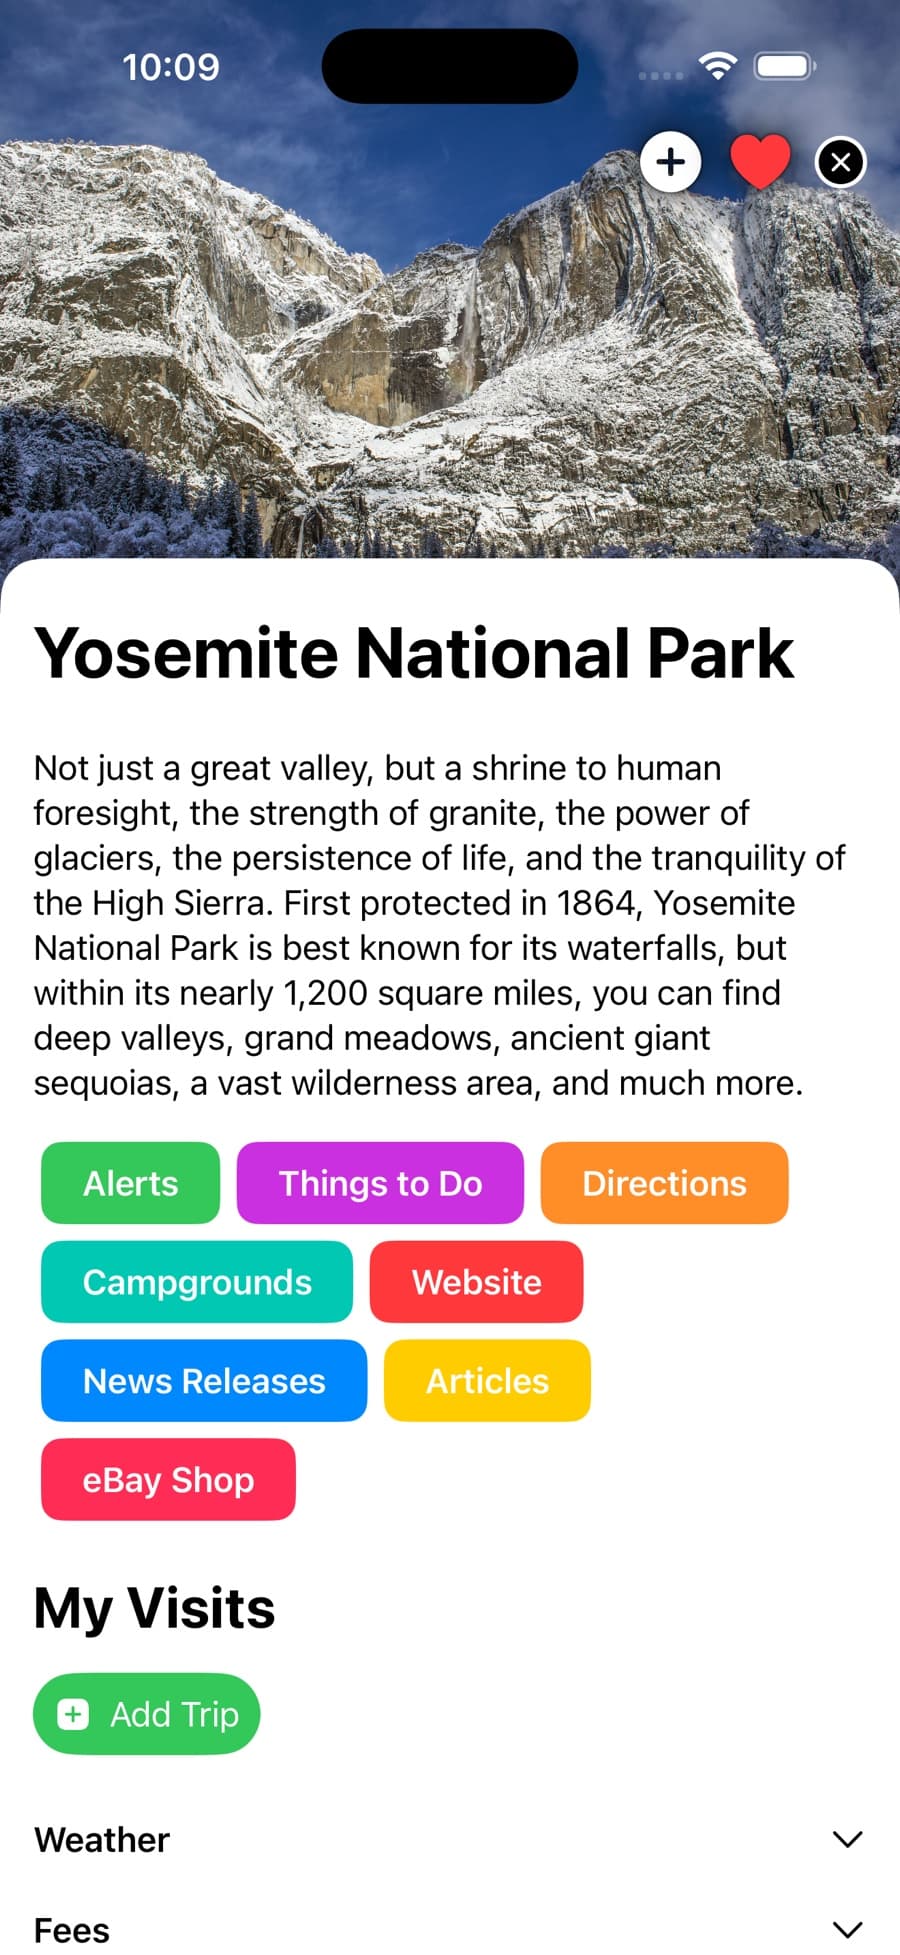
Yosemite National ParkCalifornia
Yosemite averages 216,341 visits in November, 40% of its August peak. Crowds are thinning: 77% in October, 28% in December.
Hot Springs National ParkArkansas
Hot Springs averages 149,291 visits in November, 43% of its June peak. October runs 43% and December 39%.
Arches averages 85,651 visits in November, 44% of its May peak. Crowds are thinning: 77% in October, 25% in December.
Petrified Forest National ParkArizona
Petrified Forest averages 29,030 visits in November, 45% of its June peak. October runs 70% and December 46%.
Saguaro National ParkArizona
Saguaro averages 77,571 visits in November, 50% of its March peak. Crowds are building: 35% in October, 60% in December.
White Sands National ParkNew Mexico
White Sands averages 51,103 visits in November, 52% of its March peak. October runs 54% and December 58%.
Guadalupe Mountains National ParkTexas
Guadalupe Mountains averages 19,514 visits in November, 55% of its March peak. October runs 63% and December 67%.
Carlsbad Caverns National ParkNew Mexico
Carlsbad Caverns averages 28,098 visits in November, 55% of its July peak. Crowds are building: 55% in October, 63% in December.
Everglades National ParkFlorida
Everglades averages 60,587 visits in November, 58% of its February peak. Crowds are building: 37% in October, 72% in December.
Pinnacles National ParkCalifornia
Pinnacles averages 24,668 visits in November, 63% of its April peak. October runs 55% and December 59%.
Big Bend averages 58,815 visits in November, 63% of its March peak. October runs 51% and December 63%.
Channel Islands National ParkCalifornia
Channel Islands averages 23,057 visits in November, 64% of its July peak. Crowds are thinning: 71% in October, 46% in December. No road in: you arrive by boat or plane, per NPS.
Biscayne National ParkFlorida
Biscayne averages 40,603 visits in November, 66% of its May peak. Crowds are building: 59% in October, 77% in December.
Death Valley National ParkCalifornia · Nevada
Death Valley averages 109,121 visits in November, 68% of its March peak. Crowds are building: 55% in October, 72% in December.
Congaree National ParkSouth Carolina
Congaree averages 20,935 visits in November, 72% of its May peak. Crowds are thinning: 73% in October, 59% in December.
Peak season · 2
Under 30% of the peak: few visitors, and services may be limited.
Likely closed · 8
These parks average almost no recreation visits in November. That usually means a seasonal closure or no way in, but it’s our inference from the numbers, not an NPS notice. Check before you go:
How we rank
Every number here is National Park Service recreation visits, averaged by calendar month over 2021–2025. A park’s crowd index compares each month with its own busiest month (100). Peak season is 80 or above; shoulder months border the peak and still reach 30. We rank shoulder months quietest first.
We don’t score weather, and a quiet month can be quiet because of it. The crowd calendar has the full method and every park’s twelve months side by side; each park page links to its nps.gov conditions.
November 2025 at a glance
FAQ