Skip to content
Park'd
Crowd calendar · January

The best national parks to visit in January

Last verified 4 parks in shoulder season
January puts 4 national parks in shoulder season: open, past or before the peak, and quieter for it. 4 others are at full tilt. Here’s the whole picture, ranked from five years of National Park Service visitor counts.

Big names in shoulder season

The % badge is January’s visitors as a share of the park’s busiest month.

Shoulder season · 4 parks

Our January picks, quietest first

Each park in a month that borders its busy season, ranked by how far below its own peak it runs. Open for business, without the crush. Parks right at the start or end of their season come last.
  • Quiet · under 40% of peak
  • Moderate · 40–69%
  • Busy · 70–89%
  • Peak · 90%+
  • Near-zero visits (likely closed)
  1. 1

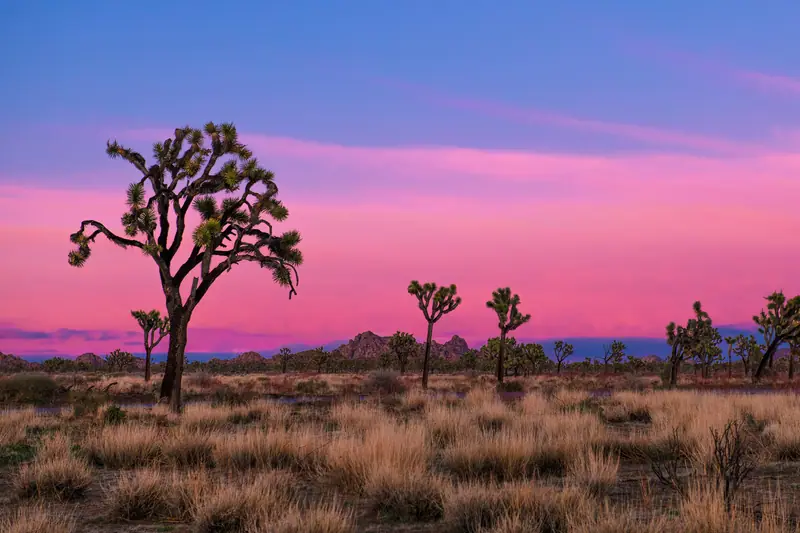
    1. Joshua Tree National ParkCalifornia

    Joshua Tree averages 264,502 visits in January, 64% of its March peak. December runs 83% and February 72%.

    Crowd index by month: Jan 64, Feb 72, Mar 100, Apr 89, May 62, Jun 43, Jul 33, Aug 34, Sep 39, Oct 51, Nov 76, Dec 83.
    January 2025: 278,104
  2. 2

    2. Biscayne National ParkFlorida

    Biscayne averages 45,467 visits in January, 74% of its May peak. December runs 77% and February 81%.

    Crowd index by month: Jan 74, Feb 81, Mar 96, Apr 90, May 100, Jun 81, Jul 95, Aug 74, Sep 74, Oct 59, Nov 66, Dec 77.
    January 2025: 32,032
  3. 3

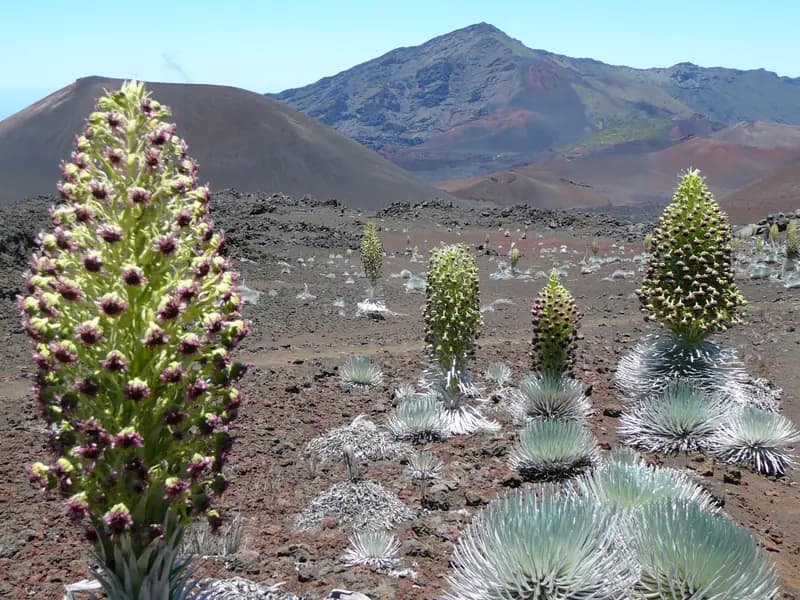
    3. Haleakalā National ParkHawaii

    Haleakalā averages 62,432 visits in January, 76% of its July peak. Crowds are thinning: 94% in December, 74% in February.

    Crowd index by month: Jan 76, Feb 74, Mar 88, Apr 88, May 97, Jun 99, Jul 100, Aug 86, Sep 85, Oct 86, Nov 82, Dec 94.
    January 2025: 59,527
  4. 4

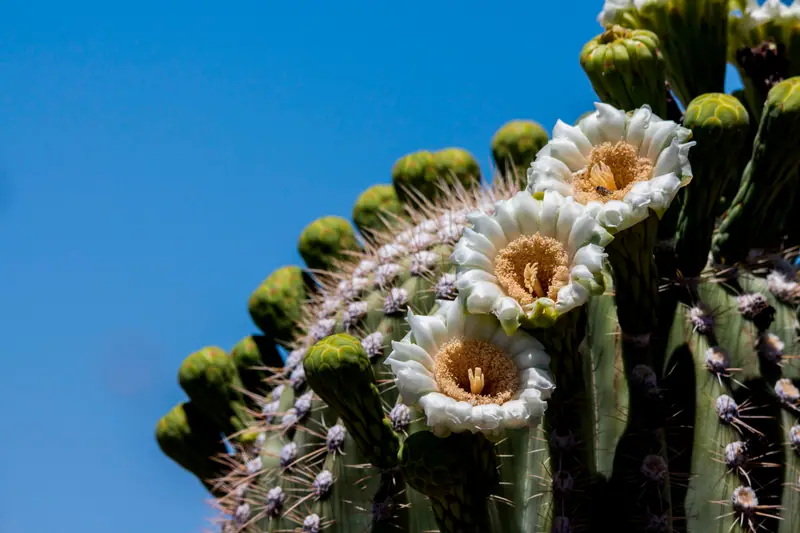
    4. Saguaro National ParkArizona

    Saguaro averages 119,624 visits in January, 77% of its March peak. Crowds are building: 60% in December, 82% in February.

    Crowd index by month: Jan 77, Feb 82, Mar 100, Apr 72, May 41, Jun 26, Jul 23, Aug 23, Sep 25, Oct 35, Nov 50, Dec 60.
    January 2025: 108,094

Low season · 13 parks

Quiet in January, often for a reason

These parks still draw at least 30% of their peak, but the month sits away from their busy season. Low season can mean heat, cold, rain or partial closures, so check the park's nps.gov page before planning around it.
  1. Grand Canyon National ParkArizona

    Grand Canyon averages 169,417 visits in January, 32% of its July peak. December runs 56% and February 34%.

    Crowd index by month: Jan 32, Feb 34, Mar 67, Apr 85, May 95, Jun 94, Jul 100, Aug 90, Sep 81, Oct 83, Nov 62, Dec 56.
    January 2025: 191,862
  2. Guadalupe Mountains National ParkTexas

    Guadalupe Mountains averages 12,020 visits in January, 34% of its March peak. December runs 67% and February 46%.

    Crowd index by month: Jan 34, Feb 46, Mar 100, Apr 79, May 56, Jun 37, Jul 38, Aug 28, Sep 35, Oct 63, Nov 55, Dec 67.
    January 2025: 8,692
  3. National Park of American SamoaAmerican Samoa

    American Samoa averages 1,079 visits in January, 35% of its April peak. Crowds are building: 17% in December, 62% in February.

    Crowd index by month: Jan 35, Feb 62, Mar 50, Apr 100, May 32, Jun 14, Jul 76, Aug 24, Sep 78, Oct 45, Nov 35, Dec 17.
    January 2025: 2,948
  4. Channel Islands National ParkCalifornia

    Channel Islands averages 12,484 visits in January, 35% of its July peak. December runs 46% and February 46%. No road in: you arrive by boat or plane, per NPS.

    Crowd index by month: Jan 35, Feb 46, Mar 60, Apr 69, May 72, Jun 89, Jul 100, Aug 85, Sep 77, Oct 71, Nov 64, Dec 46.
    January 2025: 13,762
  5. Petrified Forest National ParkArizona

    Petrified Forest averages 23,357 visits in January, 37% of its June peak. Crowds are thinning: 46% in December, 33% in February.

    Crowd index by month: Jan 37, Feb 33, Mar 74, Apr 66, May 91, Jun 100, Jul 84, Aug 66, Sep 67, Oct 70, Nov 45, Dec 46.
    January 2025: 21,962
  6. Hot Springs National ParkArkansas

    Hot Springs averages 127,539 visits in January, 37% of its June peak. December runs 39% and February 59%.

    Crowd index by month: Jan 37, Feb 59, Mar 72, Apr 68, May 66, Jun 100, Jul 83, Aug 62, Sep 37, Oct 43, Nov 43, Dec 39.
    January 2025: 106,185
  7. Carlsbad Caverns National ParkNew Mexico

    Carlsbad Caverns averages 19,549 visits in January, 38% of its July peak. December runs 63% and February 39%.

    Crowd index by month: Jan 38, Feb 39, Mar 92, Apr 73, May 67, Jun 88, Jul 100, Aug 62, Sep 53, Oct 55, Nov 55, Dec 63.
    January 2025: 23,733
  8. White Sands National ParkNew Mexico

    White Sands averages 42,273 visits in January, 43% of its March peak. Crowds are thinning: 58% in December, 42% in February.

    Crowd index by month: Jan 43, Feb 42, Mar 100, Apr 78, May 71, Jun 63, Jul 67, Aug 47, Sep 47, Oct 54, Nov 52, Dec 58.
    January 2025: 40,809
  9. Congaree National ParkSouth Carolina

    Congaree averages 13,877 visits in January, 48% of its May peak. December runs 59% and February 55%.

    Crowd index by month: Jan 48, Feb 55, Mar 98, Apr 85, May 100, Jun 71, Jul 59, Aug 47, Sep 58, Oct 73, Nov 72, Dec 59.
    January 2025: 15,129
  10. Kobuk Valley National ParkAlaska

    Kobuk Valley averages 878 visits in January, 49% of its July peak. Crowds are thinning: 75% in December, 32% in February. 2025 reported just 77 visits this month (usually about 1,099), kept as reported. No road in: you arrive by boat or plane, per NPS.

    Crowd index by month: Jan 49, Feb 32, Mar 39, Apr 37, May 38, Jun 77, Jul 100, Aug 93, Sep 84, Oct 91, Nov 72, Dec 75.
    January 2025: 77
  11. Big Bend National ParkTexas

    Big Bend averages 46,388 visits in January, 50% of its March peak. December runs 63% and February 52%.

    Crowd index by month: Jan 50, Feb 52, Mar 100, Apr 71, May 46, Jun 26, Jul 22, Aug 18, Sep 26, Oct 51, Nov 63, Dec 63.
    January 2025: 49,001
  12. Death Valley National ParkCalifornia · Nevada

    Death Valley averages 93,132 visits in January, 58% of its March peak. December runs 72% and February 73%.

    Crowd index by month: Jan 58, Feb 73, Mar 100, Apr 88, May 66, Jun 46, Jul 51, Aug 47, Sep 38, Oct 55, Nov 68, Dec 72.
    January 2025: 123,593
  13. Pinnacles National ParkCalifornia

    Pinnacles averages 23,508 visits in January, 60% of its April peak. Crowds are building: 59% in December, 67% in February.

    Crowd index by month: Jan 60, Feb 67, Mar 97, Apr 100, May 95, Jun 78, Jul 72, Aug 56, Sep 51, Oct 55, Nov 63, Dec 59.
    January 2025: 30,342

How we rank

Crowds, not weather

Every number here is National Park Service recreation visits, averaged by calendar month over 2021–2025. A park’s crowd index compares each month with its own busiest month (100). Peak season is 80 or above; shoulder months border the peak and still reach 30. We rank shoulder months quietest first.

We don’t score weather, and a quiet month can be quiet because of it. The crowd calendar has the full method and every park’s twelve months side by side; each park page links to its nps.gov conditions.

January 2025 at a glance

The small figure on each row is the park’s actual January 2025 count from NPS Visitor Use Statistics. Unusual months are kept as reported and flagged in the text.

FAQ

National parks in January, answered

What are the best national parks to visit in January?
For fewer crowds without the off-season, look at the parks in shoulder season in January: Joshua Tree, Biscayne, Haleakalā and Saguaro. They're ranked quietest first on this page, from NPS visitor counts for 2021–2025.
Which national parks are busiest in January?
4 parks are in peak season in January, led by Everglades, Hawaiʻi Volcanoes, Virgin Islands and Dry Tortugas.
Which national parks are closed in January?
We can't say for certain from visitor counts, but Gates of the Arctic, Glacier Bay, Isle Royale, Katmai, Kenai Fjords, Lake Clark, North Cascades and Wrangell–St. Elias average almost no visits in January, which usually means a seasonal closure or no way in. Check each park's nps.gov page.
Is January a busy month in the national parks?
Across all 63 parks combined, January averages about 2,953,334 recreation visits, the 12th busiest month of the year (2021–2025 average).

Sources · 2

  1. 1.NPS Visitor Use Statistics — monthly recreation visits, 2021–2025 (IRMA stats REST service) · National Park Service (U.S. Department of the Interior) — Visitor Use Statistics Program
  2. 2.NPS Visitor Use Statistics Definitions · National Park Service

Park'd · free on iPhone & Android

Your parks map, in your pocket.

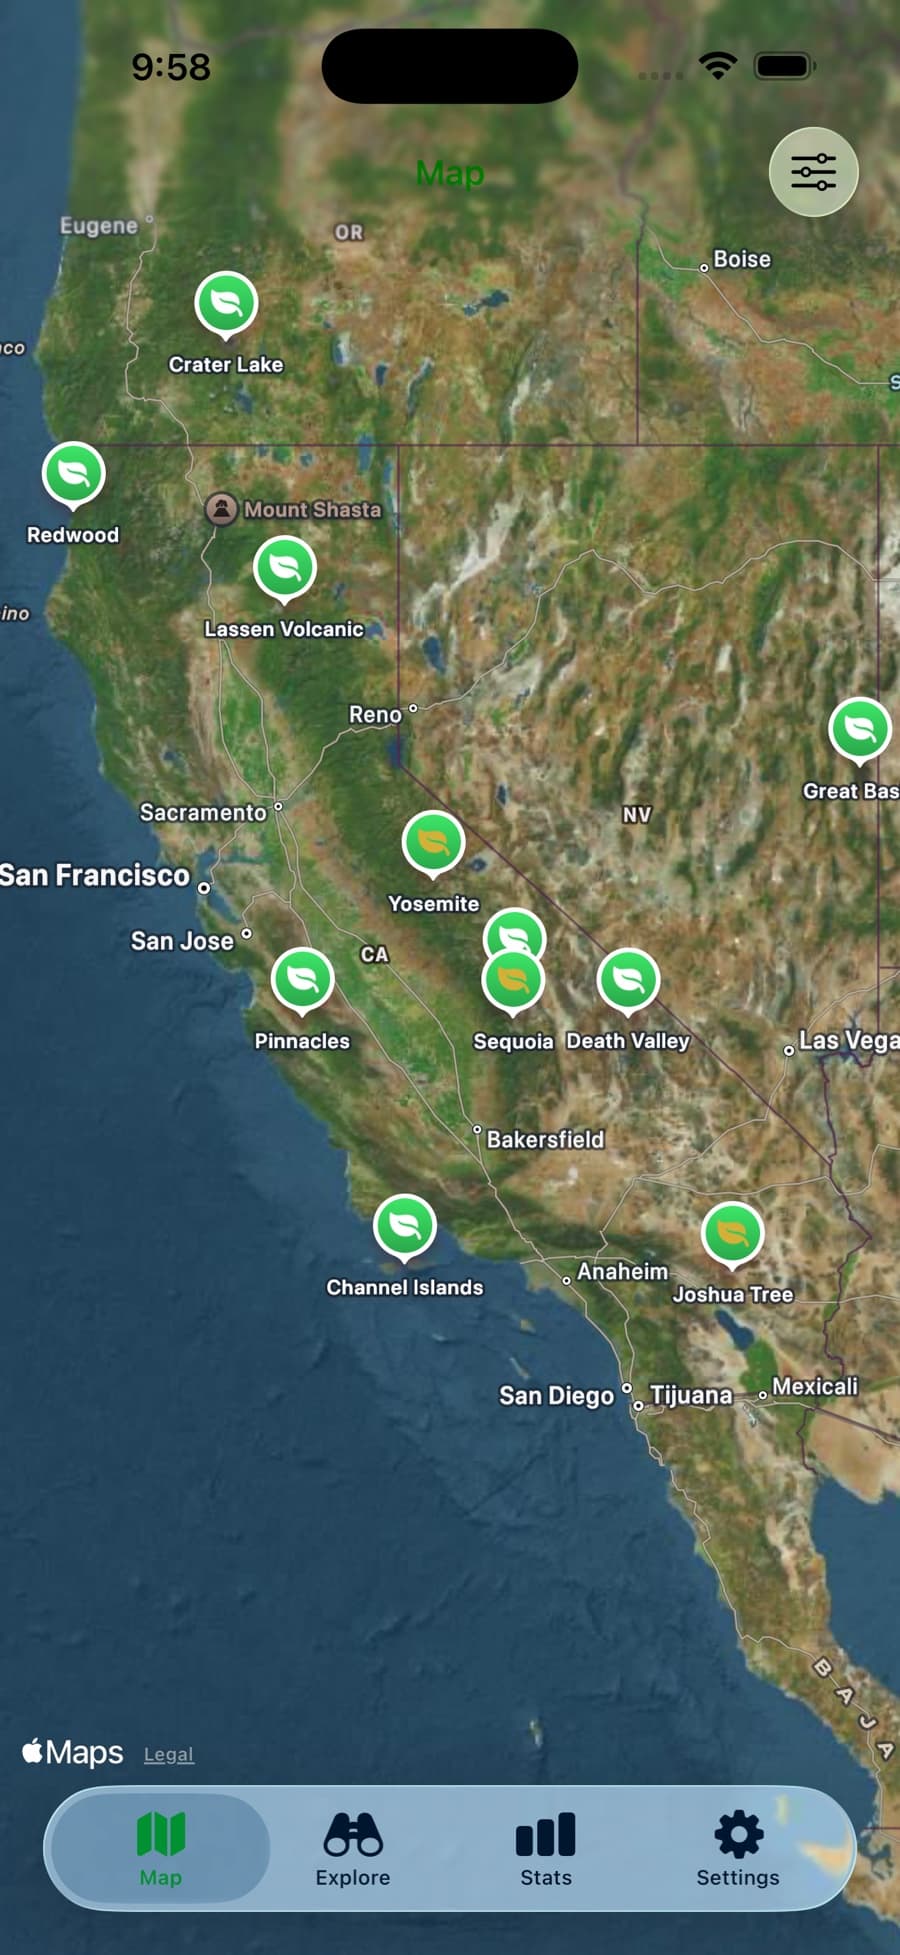
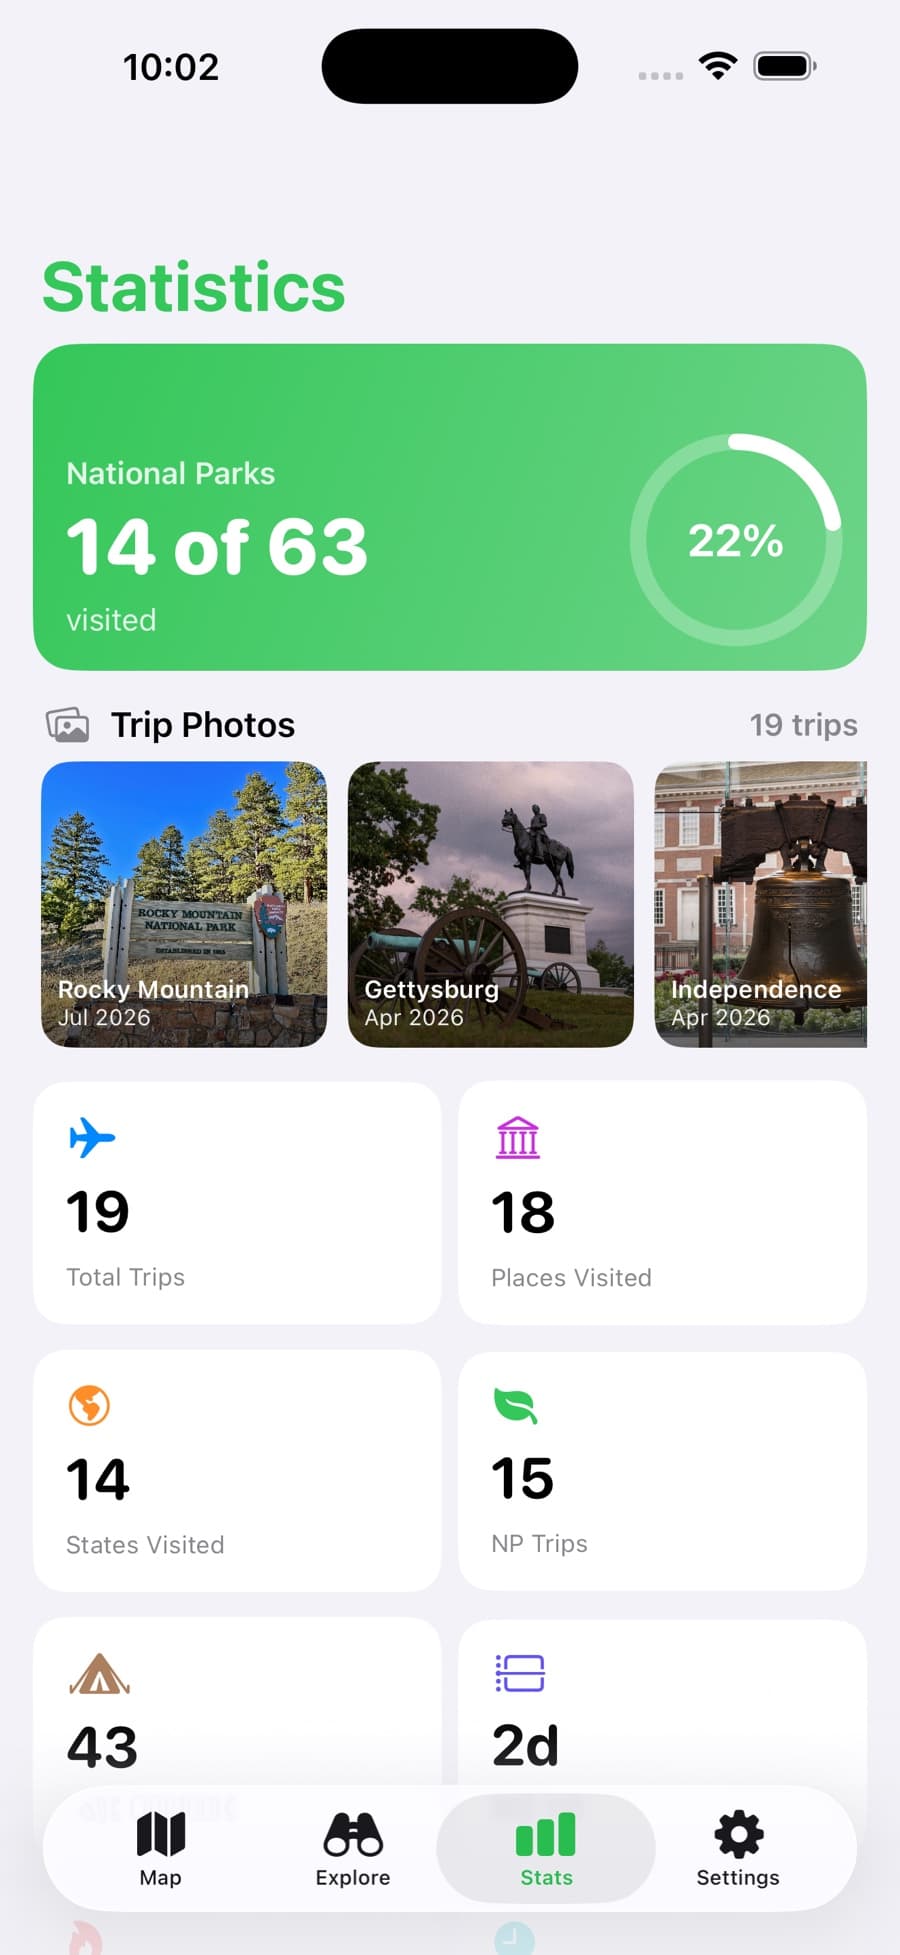
Park'd for iPhone and Android: check off every national park on a map, log trips with photos, notes and a favorite memory, and watch your stats and badges grow.


Download on the App StoreGet it on Google Play