Skip to content
Park'd
Crowd calendar · October

The best national parks to visit in October

Last verified 9 parks in shoulder season
October puts 9 national parks in shoulder season: open, past or before the peak, and quieter for it. 8 others are at full tilt. Here’s the whole picture, ranked from five years of National Park Service visitor counts.

Big names in shoulder season

The % badge is October’s visitors as a share of the park’s busiest month.

Shoulder season · 9 parks

Our October picks, quietest first

Each park in a month that borders its busy season, ranked by how far below its own peak it runs. Open for business, without the crush. Parks right at the start or end of their season come last.
  • Quiet · under 40% of peak
  • Moderate · 40–69%
  • Busy · 70–89%
  • Peak · 90%+
  • Near-zero visits (likely closed)
  1. 1

    1. Black Canyon of the Gunnison National ParkColoradoIts quiet month

    Black Canyon of the Gunnison averages 29,766 visits in October, 61% of its June peak. Crowds are thinning: 98% in September, 29% in November. By our rule, this is Black Canyon of the Gunnison's quiet shoulder month.

    Crowd index by month: Jan 19, Feb 14, Mar 19, Apr 26, May 71, Jun 100, Jul 97, Aug 90, Sep 98, Oct 61, Nov 29, Dec 16.
    October 2025: 23,148
  2. 2

    2. Bryce Canyon National ParkUtah

    Bryce Canyon averages 235,422 visits in October, 71% of its June peak. Crowds are thinning: 98% in September, 24% in November.

    Crowd index by month: Jan 10, Feb 11, Mar 30, Apr 65, May 90, Jun 100, Jul 91, Aug 81, Sep 98, Oct 71, Nov 24, Dec 17.
    October 2025: 202,248
  3. 3

    3. Arches National ParkUtah

    Arches averages 150,241 visits in October, 77% of its May peak. Crowds are thinning: 84% in September, 44% in November.

    Crowd index by month: Jan 19, Feb 26, Mar 74, Apr 83, May 100, Jun 97, Jul 87, Aug 77, Sep 84, Oct 77, Nov 44, Dec 25.
    October 2025: 158,262
  4. 4

    4. Yosemite National ParkCalifornia

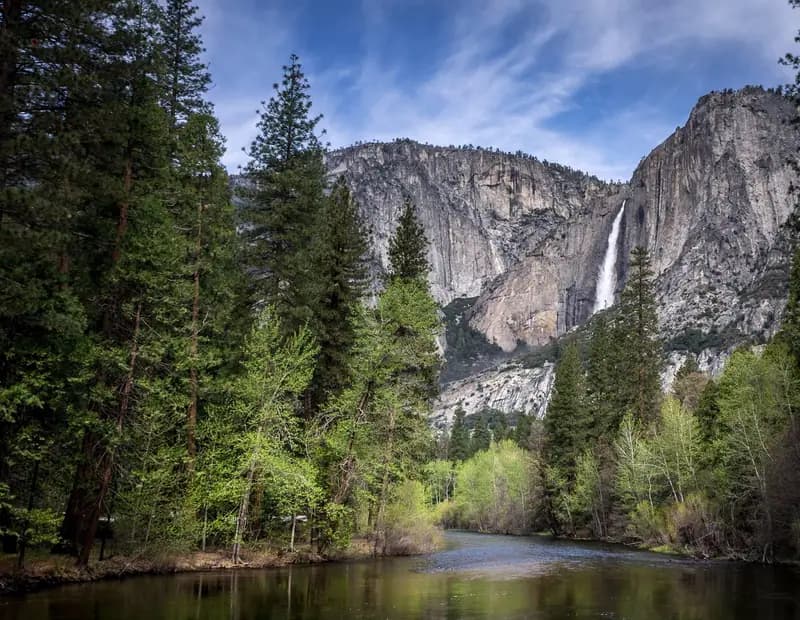
    Yosemite averages 412,607 visits in October, 77% of its August peak. Crowds are thinning: 88% in September, 40% in November.

    Crowd index by month: Jan 21, Feb 24, Mar 25, Apr 48, May 71, Jun 95, Jul 100, Aug 100, Sep 88, Oct 77, Nov 40, Dec 28.
    October 2025: 445,779
  5. 5

    5. Hawaiʻi Volcanoes National ParkHawaii

    Hawaiʻi Volcanoes averages 117,453 visits in October, 78% of its December peak. Crowds are building: 77% in September, 87% in November.

    Crowd index by month: Jan 94, Feb 82, Mar 79, Apr 73, May 75, Jun 96, Jul 97, Aug 92, Sep 77, Oct 78, Nov 87, Dec 100.
    October 2025: 125,237
  6. 6

    6. Canyonlands National ParkUtah

    Canyonlands averages 96,016 visits in October, 79% of its May peak. Crowds are thinning: 81% in September, 35% in November.

    Crowd index by month: Jan 9, Feb 14, Mar 64, Apr 88, May 100, Jun 76, Jul 59, Aug 52, Sep 81, Oct 79, Nov 35, Dec 16.
    October 2025: 87,556
  7. 7

    7. Yellowstone National ParkIdaho · Montana · WyomingIts quiet monthSeason’s end

    Yellowstone averages 302,468 visits in October, 33% of its July peak. It's the last busy month of the season: 86% in September, then 3% in November. By our rule, this is Yellowstone's quiet shoulder month.

    Crowd index by month: Jan 5, Feb 5, Mar 4, Apr 8, May 55, Jun 90, Jul 100, Aug 89, Sep 86, Oct 33, Nov 3, Dec 4.
    October 2025: 313,959
  8. 8

    8. Great Basin National ParkNevadaSeason’s end

    Great Basin averages 16,599 visits in October, 64% of its July peak. It's the last busy month of the season: 94% in September, then 9% in November.

    Crowd index by month: Jan 8, Feb 7, Mar 10, Apr 31, May 58, Jun 99, Jul 100, Aug 83, Sep 94, Oct 64, Nov 9, Dec 7.
    October 2025: 14,465
  9. 9

    9. Acadia National ParkMaineIts quiet monthSeason’s end

    Acadia averages 557,411 visits in October, 70% of its August peak. It's the last busy month of the season: 83% in September, then 9% in November. By our rule, this is Acadia's quiet shoulder month.

    Crowd index by month: Jan 2, Feb 2, Mar 4, Apr 13, May 41, Jun 77, Jul 98, Aug 100, Sep 83, Oct 70, Nov 9, Dec 2.
    October 2025: 599,253

Low season · 32 parks

Quiet in October, often for a reason

These parks still draw at least 30% of their peak, but the month sits away from their busy season. Low season can mean heat, cold, rain or partial closures, so check the park's nps.gov page before planning around it.
  1. Saguaro National ParkArizona

    Saguaro averages 54,673 visits in October, 35% of its March peak. Crowds are building: 25% in September, 50% in November.

    Crowd index by month: Jan 77, Feb 82, Mar 100, Apr 72, May 41, Jun 26, Jul 23, Aug 23, Sep 25, Oct 35, Nov 50, Dec 60.
    October 2025: 34,859
  2. Everglades National ParkFlorida

    Everglades averages 38,164 visits in October, 37% of its February peak. September runs 42% and November 58%.

    Crowd index by month: Jan 99, Feb 100, Mar 99, Apr 86, May 67, Jun 67, Jul 68, Aug 59, Sep 42, Oct 37, Nov 58, Dec 72.
    October 2025: 19,008
  3. Virgin Islands National ParkUS Virgin Islands

    Virgin Islands averages 15,848 visits in October, 40% of its March peak. Crowds are building: 34% in September, 69% in November.

    Crowd index by month: Jan 88, Feb 83, Mar 100, Apr 91, May 81, Jun 81, Jul 79, Aug 49, Sep 34, Oct 40, Nov 69, Dec 89.
    October 2025: 13,494
  4. Great Sand Dunes National Park & PreserveColorado

    Great Sand Dunes averages 39,055 visits in October, 41% of its June peak. Crowds are thinning: 53% in September, 14% in November.

    Crowd index by month: Jan 6, Feb 8, Mar 21, Apr 28, May 76, Jun 100, Jul 96, Aug 73, Sep 53, Oct 41, Nov 14, Dec 9.
    October 2025: 33,912
  5. Indiana Dunes National ParkIndiana

    Indiana Dunes averages 212,361 visits in October, 42% of its July peak. Crowds are thinning: 53% in September, 23% in November.

    Crowd index by month: Jan 15, Feb 16, Mar 26, Apr 33, May 57, Jun 86, Jul 100, Aug 83, Sep 53, Oct 42, Nov 23, Dec 20.
    October 2025: 202,163
  6. Olympic National ParkWashington

    Olympic averages 263,849 visits in October, 42% of its August peak. Crowds are thinning: 67% in September, 28% in November.

    Crowd index by month: Jan 13, Feb 15, Mar 21, Apr 21, May 40, Jun 48, Jul 80, Aug 100, Sep 67, Oct 42, Nov 28, Dec 16.
    October 2025: 323,073
  7. Kings Canyon National ParkCalifornia

    Kings Canyon averages 51,007 visits in October, 43% of its July peak. Crowds are thinning: 62% in September, 24% in November.

    Crowd index by month: Jan 17, Feb 13, Mar 14, Apr 30, May 71, Jun 92, Jul 100, Aug 80, Sep 62, Oct 43, Nov 24, Dec 15.
    October 2025: 68,186
  8. Hot Springs National ParkArkansas

    Hot Springs averages 149,687 visits in October, 43% of its June peak. September runs 37% and November 43%.

    Crowd index by month: Jan 37, Feb 59, Mar 72, Apr 68, May 66, Jun 100, Jul 83, Aug 62, Sep 37, Oct 43, Nov 43, Dec 39.
    October 2025: 147,930
  9. National Park of American SamoaAmerican Samoa

    American Samoa averages 1,416 visits in October, 45% of its April peak. Crowds are thinning: 78% in September, 35% in November. 2025 reported just 0 visits this month (usually about 1,244), kept as reported.

    Crowd index by month: Jan 35, Feb 62, Mar 50, Apr 100, May 32, Jun 14, Jul 76, Aug 24, Sep 78, Oct 45, Nov 35, Dec 17.
    October 2025: 0
  10. Sequoia National ParkCalifornia

    Sequoia averages 93,195 visits in October, 48% of its July peak. Crowds are thinning: 63% in September, 31% in November.

    Crowd index by month: Jan 23, Feb 21, Mar 29, Apr 42, May 62, Jun 69, Jul 100, Aug 92, Sep 63, Oct 48, Nov 31, Dec 24.
    October 2025: 122,794
  11. Rocky Mountain National ParkColorado

    Rocky Mountain averages 400,367 visits in October, 50% of its July peak. Crowds are thinning: 75% in September, 19% in November.

    Crowd index by month: Jan 15, Feb 14, Mar 19, Apr 21, May 40, Jun 79, Jul 100, Aug 85, Sep 75, Oct 50, Nov 19, Dec 16.
    October 2025: 382,163
  12. Big Bend National ParkTexas

    Big Bend averages 47,188 visits in October, 51% of its March peak. Crowds are building: 26% in September, 63% in November.

    Crowd index by month: Jan 50, Feb 52, Mar 100, Apr 71, May 46, Jun 26, Jul 22, Aug 18, Sep 26, Oct 51, Nov 63, Dec 63.
    October 2025: 47,064
  13. Joshua Tree National ParkCalifornia

    Joshua Tree averages 209,037 visits in October, 51% of its March peak. Crowds are building: 39% in September, 76% in November.

    Crowd index by month: Jan 64, Feb 72, Mar 100, Apr 89, May 62, Jun 43, Jul 33, Aug 34, Sep 39, Oct 51, Nov 76, Dec 83.
    October 2025: 163,674
  14. Mesa Verde National ParkColorado

    Mesa Verde averages 48,993 visits in October, 52% of its June peak. Crowds are thinning: 66% in September, 15% in November.

    Crowd index by month: Jan 7, Feb 7, Mar 17, Apr 30, May 60, Jun 100, Jul 95, Aug 74, Sep 66, Oct 52, Nov 15, Dec 9.
    October 2025: 48,708
  15. Redwood National and State ParksCalifornia

    Redwood averages 49,415 visits in October, 52% of its June peak. Crowds are thinning: 76% in September, 30% in November.

    Crowd index by month: Jan 26, Feb 26, Mar 34, Apr 43, May 68, Jun 100, Jul 96, Aug 85, Sep 76, Oct 52, Nov 30, Dec 24.
    October 2025: 77,984
  16. White Sands National ParkNew Mexico

    White Sands averages 53,137 visits in October, 54% of its March peak. September runs 47% and November 52%.

    Crowd index by month: Jan 43, Feb 42, Mar 100, Apr 78, May 71, Jun 63, Jul 67, Aug 47, Sep 47, Oct 54, Nov 52, Dec 58.
    October 2025: 22,389
  17. Pinnacles National ParkCalifornia

    Pinnacles averages 21,236 visits in October, 55% of its April peak. Crowds are building: 51% in September, 63% in November.

    Crowd index by month: Jan 60, Feb 67, Mar 97, Apr 100, May 95, Jun 78, Jul 72, Aug 56, Sep 51, Oct 55, Nov 63, Dec 59.
    October 2025: 16,898
  18. Carlsbad Caverns National ParkNew Mexico

    Carlsbad Caverns averages 27,986 visits in October, 55% of its July peak. September runs 53% and November 55%. 2025 reported just 0 visits this month (usually about 35,323), kept as reported.

    Crowd index by month: Jan 38, Feb 39, Mar 92, Apr 73, May 67, Jun 88, Jul 100, Aug 62, Sep 53, Oct 55, Nov 55, Dec 63.
    October 2025: 0
  19. Death Valley National ParkCalifornia · Nevada

    Death Valley averages 88,753 visits in October, 55% of its March peak. Crowds are building: 38% in September, 68% in November.

    Crowd index by month: Jan 58, Feb 73, Mar 100, Apr 88, May 66, Jun 46, Jul 51, Aug 47, Sep 38, Oct 55, Nov 68, Dec 72.
    October 2025: 110,294
  20. Mammoth Cave National ParkKentucky

    Mammoth Cave averages 55,994 visits in October, 56% of its July peak. Crowds are thinning: 58% in September, 33% in November. 2025 reported just 12,646 visits this month (usually about 67,103), kept as reported.

    Crowd index by month: Jan 15, Feb 21, Mar 62, Apr 63, May 62, Jun 84, Jul 100, Aug 69, Sep 58, Oct 56, Nov 33, Dec 29.
    October 2025: 12,646
  21. Dry Tortugas National ParkFlorida

    Dry Tortugas averages 4,965 visits in October, 57% of its May peak. September runs 67% and November 74%. No road in: you arrive by boat or plane, per NPS.

    Crowd index by month: Jan 81, Feb 75, Mar 91, Apr 91, May 100, Jun 94, Jul 86, Aug 74, Sep 67, Oct 57, Nov 74, Dec 84.
    October 2025: 5,327
  22. Biscayne National ParkFlorida

    Biscayne averages 36,611 visits in October, 59% of its May peak. September runs 74% and November 66%.

    Crowd index by month: Jan 74, Feb 81, Mar 96, Apr 90, May 100, Jun 81, Jul 95, Aug 74, Sep 74, Oct 59, Nov 66, Dec 77.
    October 2025: 22,367
  23. Guadalupe Mountains National ParkTexas

    Guadalupe Mountains averages 22,294 visits in October, 63% of its March peak. September runs 35% and November 55%.

    Crowd index by month: Jan 34, Feb 46, Mar 100, Apr 79, May 56, Jun 37, Jul 38, Aug 28, Sep 35, Oct 63, Nov 55, Dec 67.
    October 2025: 17,288
  24. New River Gorge National Park & PreserveWest Virginia

    New River Gorge averages 193,526 visits in October, 69% of its July peak. September runs 66% and November 33%.

    Crowd index by month: Jan 13, Feb 16, Mar 33, Apr 40, May 70, Jun 82, Jul 100, Aug 84, Sep 66, Oct 69, Nov 33, Dec 18.
    October 2025: 268,526
  25. Petrified Forest National ParkArizona

    Petrified Forest averages 44,784 visits in October, 70% of its June peak. September runs 67% and November 45%. 2025 reported just 0 visits this month (usually about 56,459), kept as reported.

    Crowd index by month: Jan 37, Feb 33, Mar 74, Apr 66, May 91, Jun 100, Jul 84, Aug 66, Sep 67, Oct 70, Nov 45, Dec 46.
    October 2025: 0
  26. Channel Islands National ParkCalifornia

    Channel Islands averages 25,322 visits in October, 71% of its July peak. Crowds are thinning: 77% in September, 64% in November. No road in: you arrive by boat or plane, per NPS.

    Crowd index by month: Jan 35, Feb 46, Mar 60, Apr 69, May 72, Jun 89, Jul 100, Aug 85, Sep 77, Oct 71, Nov 64, Dec 46.
    October 2025: 10,724
  27. Congaree National ParkSouth Carolina

    Congaree averages 21,349 visits in October, 73% of its May peak. September runs 58% and November 72%.

    Crowd index by month: Jan 48, Feb 55, Mar 98, Apr 85, May 100, Jun 71, Jul 59, Aug 47, Sep 58, Oct 73, Nov 72, Dec 59.
    October 2025: 22,673
  28. Mount Rainier National ParkWashingtonSeason’s end

    Mount Rainier averages 134,477 visits in October, 32% of its July peak. It's the last busy month of the season: 56% in September, then 7% in November.

    Crowd index by month: Jan 6, Feb 4, Mar 6, Apr 7, May 20, Jun 53, Jul 100, Aug 95, Sep 56, Oct 32, Nov 7, Dec 5.
    October 2025: 98,921
  29. Theodore Roosevelt National ParkNorth DakotaSeason’s end

    Theodore Roosevelt averages 54,275 visits in October, 34% of its July peak. It's the last busy month of the season: 75% in September, then 7% in November.

    Crowd index by month: Jan 2, Feb 2, Mar 6, Apr 7, May 45, Jun 85, Jul 100, Aug 93, Sep 75, Oct 34, Nov 7, Dec 1.
    October 2025: 50,520
  30. Grand Teton National ParkWyomingSeason’s end

    Grand Teton averages 247,505 visits in October, 34% of its July peak. It's the last busy month of the season: 77% in September, then 7% in November.

    Crowd index by month: Jan 8, Feb 8, Mar 9, Apr 10, May 42, Jun 86, Jul 100, Aug 92, Sep 77, Oct 34, Nov 7, Dec 7.
    October 2025: 281,020
  31. Lassen Volcanic National ParkCaliforniaSeason’s end

    Lassen Volcanic averages 37,677 visits in October, 35% of its July peak. It's the last busy month of the season: 47% in September, then 9% in November.

    Crowd index by month: Jan 8, Feb 7, Mar 6, Apr 11, May 31, Jun 72, Jul 100, Aug 56, Sep 47, Oct 35, Nov 9, Dec 6.
    October 2025: 44,904
  32. Glacier Bay National Park & PreserveAlaskaSeason’s end

    Glacier Bay averages 43,949 visits in October, 38% of its July peak. It's the last busy month of the season: 75% in September, then 0% in November. No road in: you arrive by boat or plane, per NPS.

    Crowd index by month: Jan 0, Feb 0, Mar 0, Apr 6, May 70, Jun 92, Jul 100, Aug 98, Sep 75, Oct 38, Nov 0, Dec 0.
    October 2025: 28,121

Peak season · 8

Expect crowds in October

Deep off-season

Under 30% of the peak: few visitors, and services may be limited.

Likely closed · 2

Near-zero visits

These parks average almost no recreation visits in October. That usually means a seasonal closure or no way in, but it’s our inference from the numbers, not an NPS notice. Check before you go:

How we rank

Crowds, not weather

Every number here is National Park Service recreation visits, averaged by calendar month over 2021–2025. A park’s crowd index compares each month with its own busiest month (100). Peak season is 80 or above; shoulder months border the peak and still reach 30. We rank shoulder months quietest first.

We don’t score weather, and a quiet month can be quiet because of it. The crowd calendar has the full method and every park’s twelve months side by side; each park page links to its nps.gov conditions.

October 2025 at a glance

The small figure on each row is the park’s actual October 2025 count from NPS Visitor Use Statistics. Unusual months are kept as reported and flagged in the text.

FAQ

National parks in October, answered

What are the best national parks to visit in October?
For fewer crowds without the off-season, look at the parks in shoulder season in October: Black Canyon of the Gunnison, Bryce Canyon, Arches, Yosemite, Hawaiʻi Volcanoes and Canyonlands, and 3 more. They're ranked quietest first on this page, from NPS visitor counts for 2021–2025.
Which national parks are busiest in October?
8 parks are in peak season in October, led by Great Smoky Mountains, Shenandoah, Kobuk Valley and Haleakalā. For Great Smoky Mountains and Shenandoah, October is the busiest month of the year.
Which national parks are closed in October?
We can't say for certain from visitor counts, but Gates of the Arctic and Lake Clark average almost no visits in October, which usually means a seasonal closure or no way in. Check each park's nps.gov page.
Is October a busy month in the national parks?
Across all 63 parks combined, October averages about 8,521,788 recreation visits, the 6th busiest month of the year (2021–2025 average).

Sources · 2

  1. 1.NPS Visitor Use Statistics — monthly recreation visits, 2021–2025 (IRMA stats REST service) · National Park Service (U.S. Department of the Interior) — Visitor Use Statistics Program
  2. 2.NPS Visitor Use Statistics Definitions · National Park Service

Park'd · free on iPhone & Android

Your parks map, in your pocket.

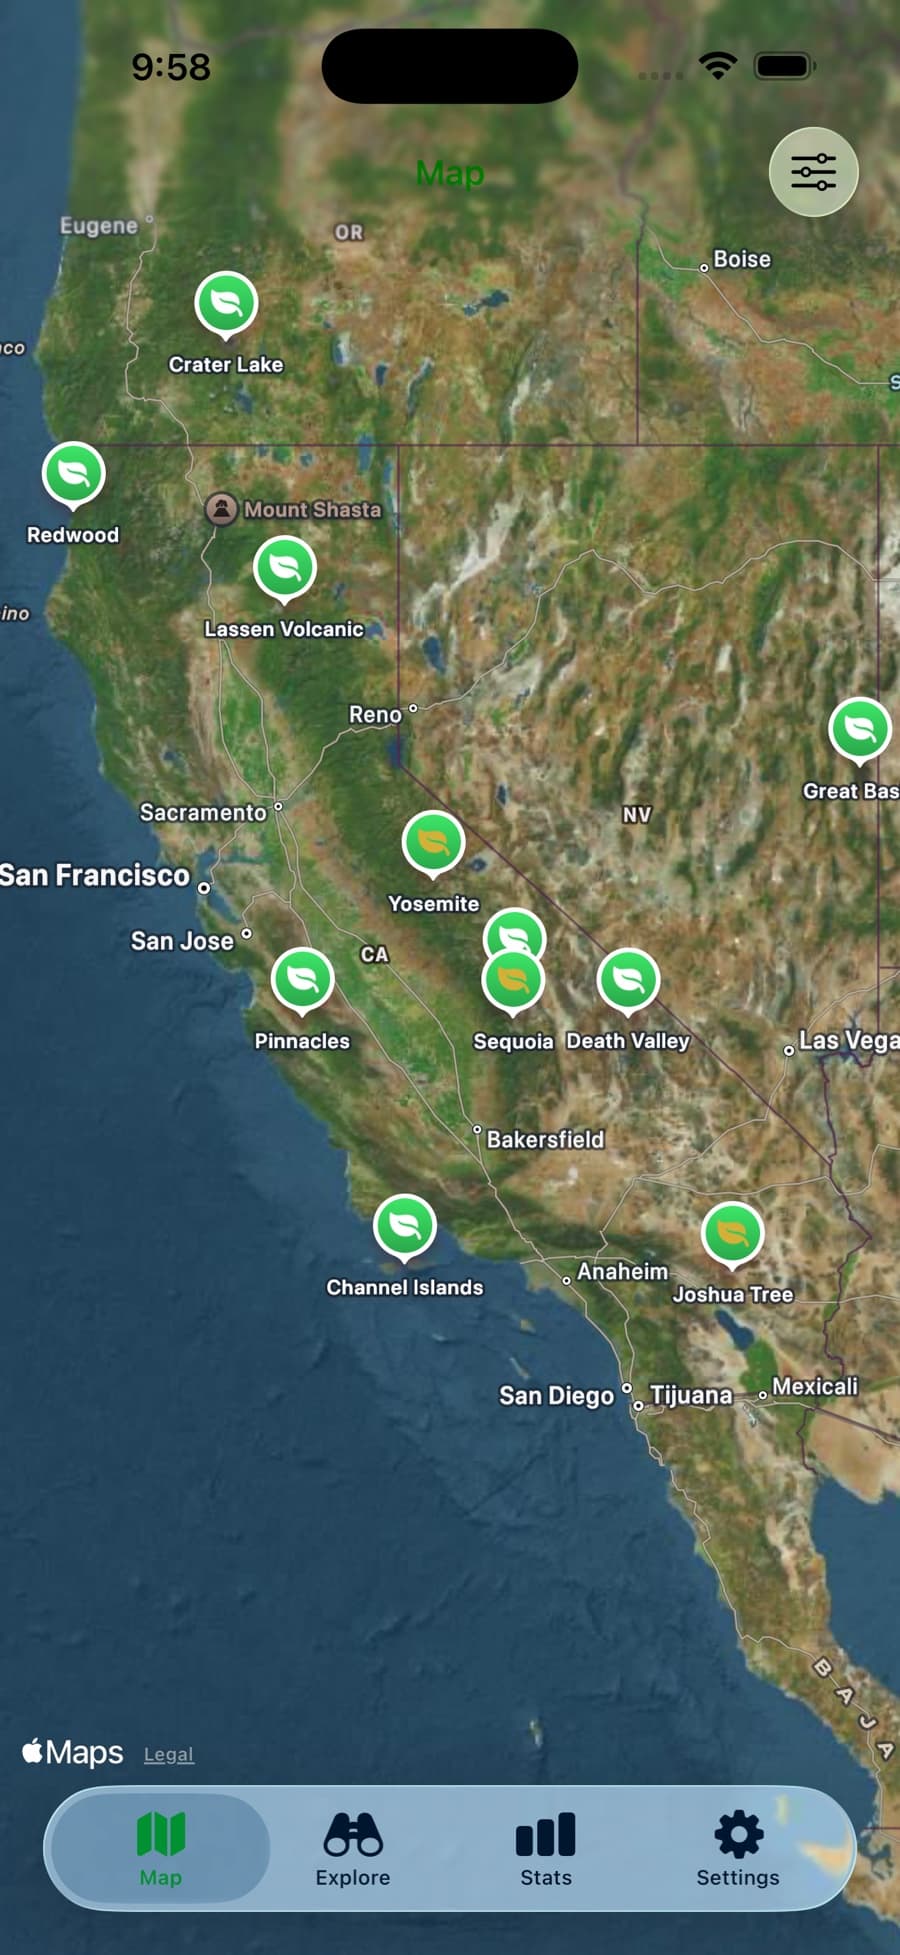
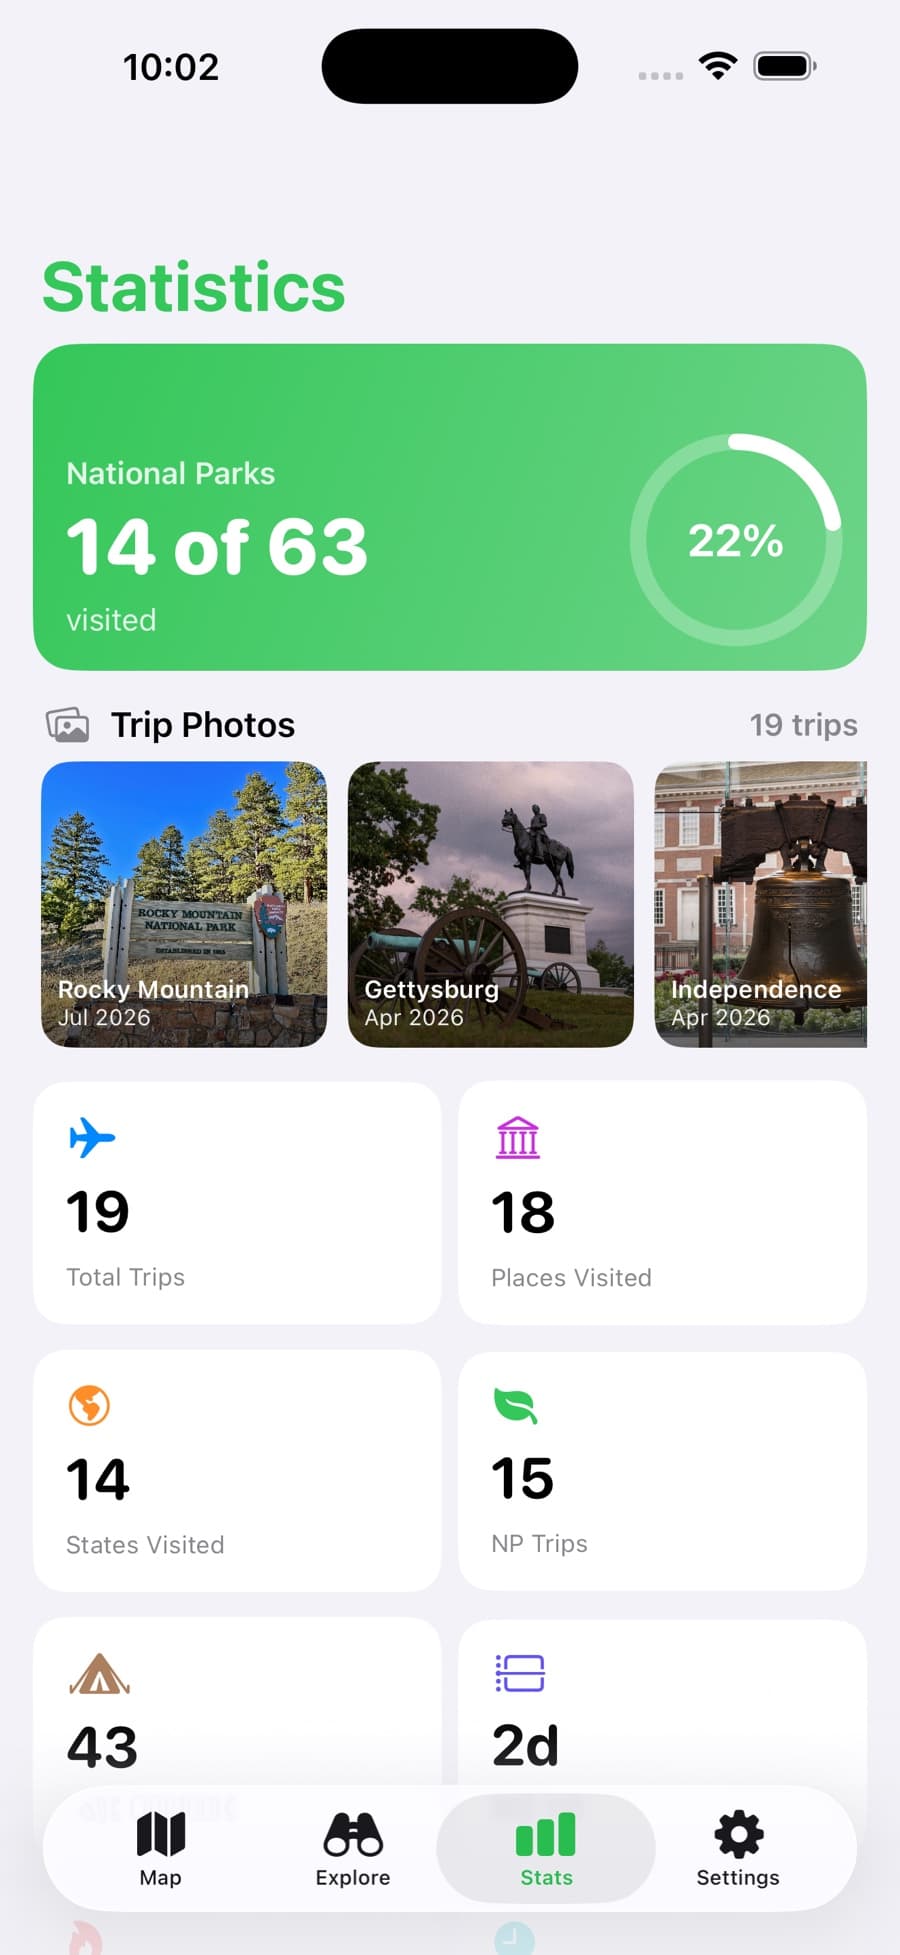
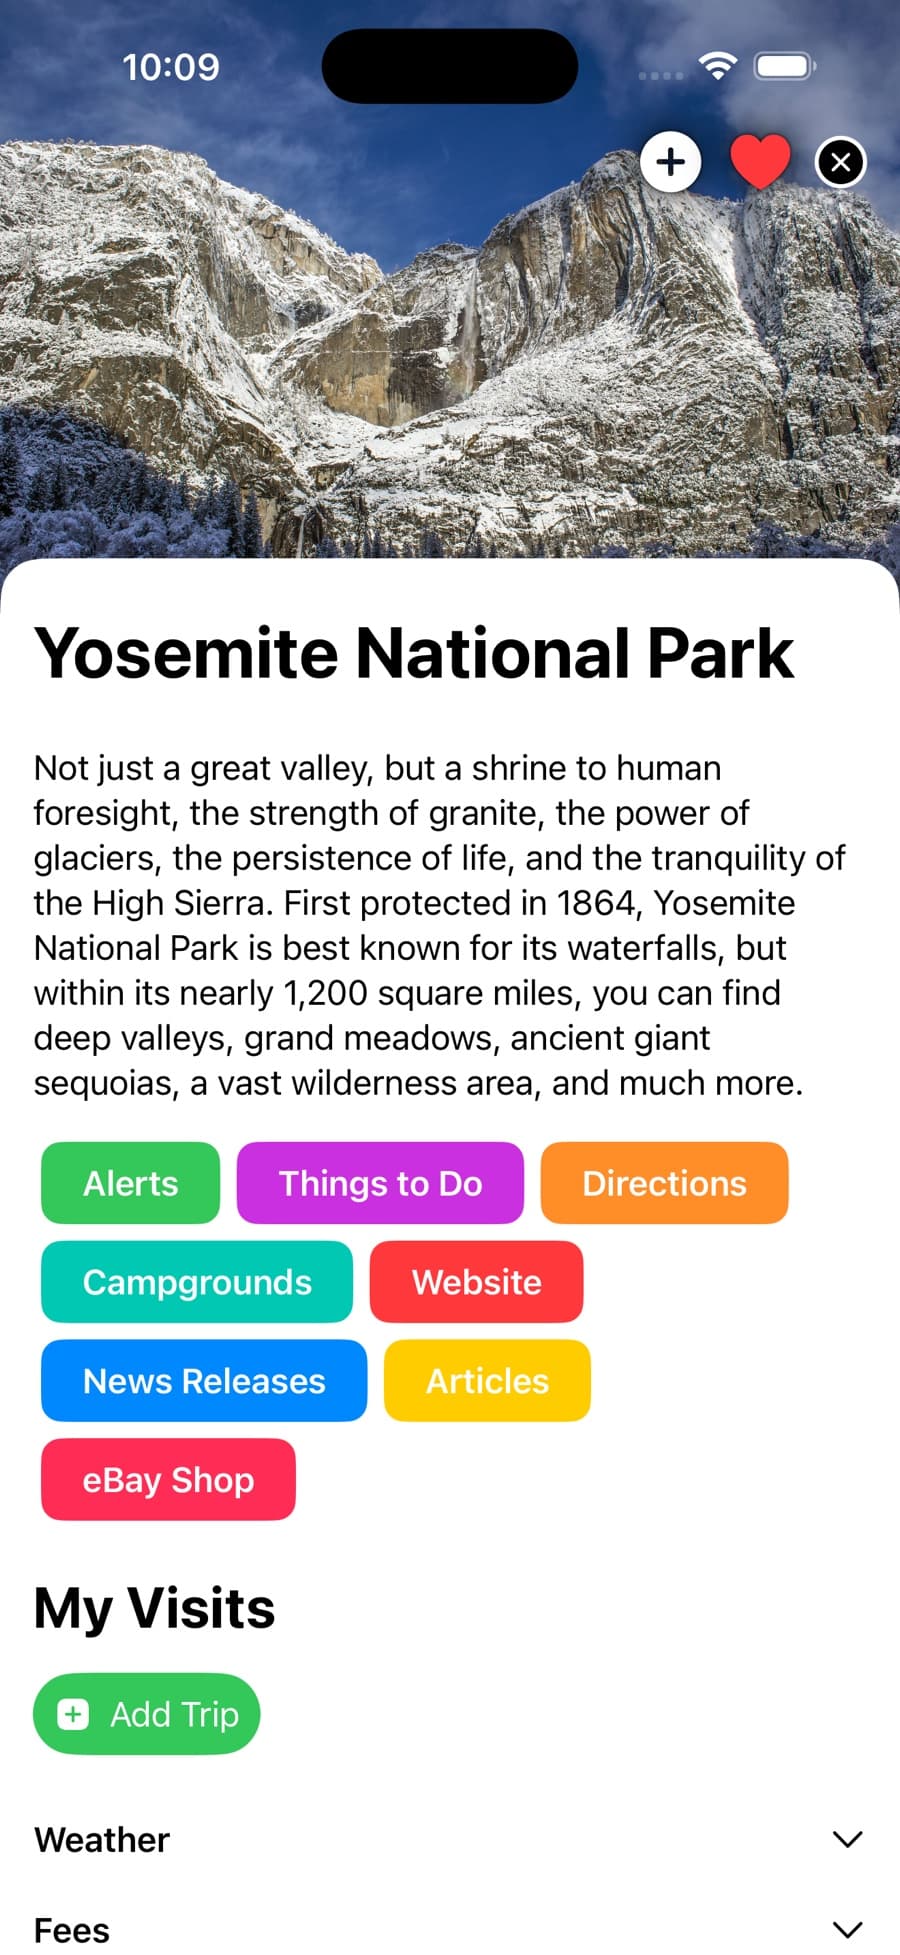
Park'd for iPhone and Android: check off every national park on a map, log trips with photos, notes and a favorite memory, and watch your stats and badges grow.

Download on the App StoreGet it on Google Play